StateExplorer - a graphical interface for curation of states from continues data
StateExplorer is a simple graphical interface for visualizing and curation of states from continues data.
Features of StateExplorer
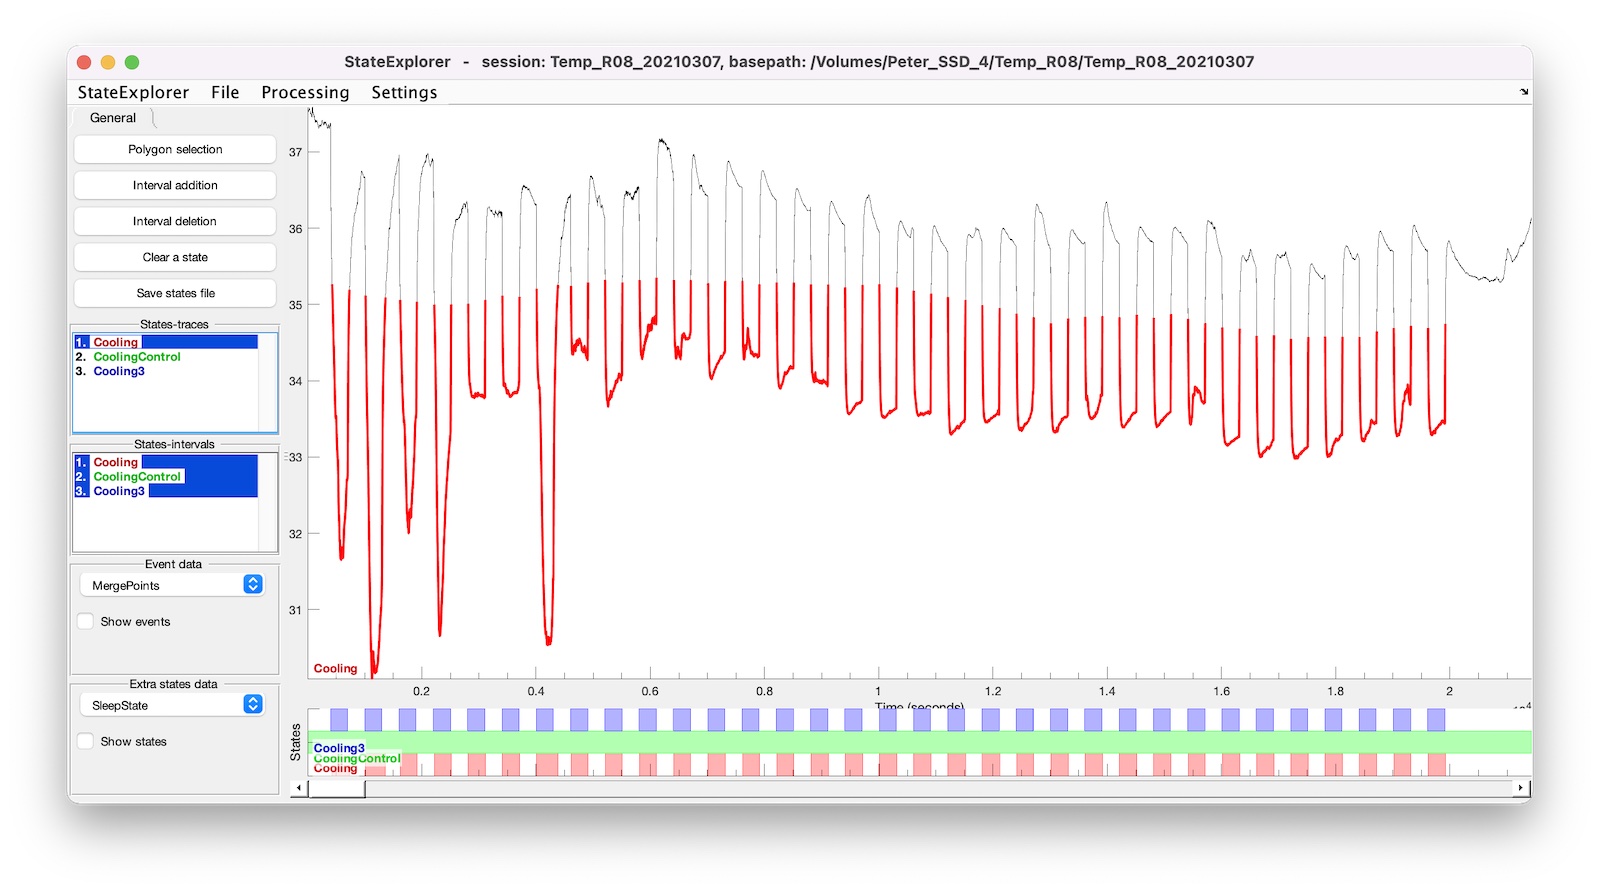
You can create temporal states from the time series trace, by drawing polygons around the trace or directly by defining the temporal intervals. Intervals can be deleted
Show events and states data in StateExplorer
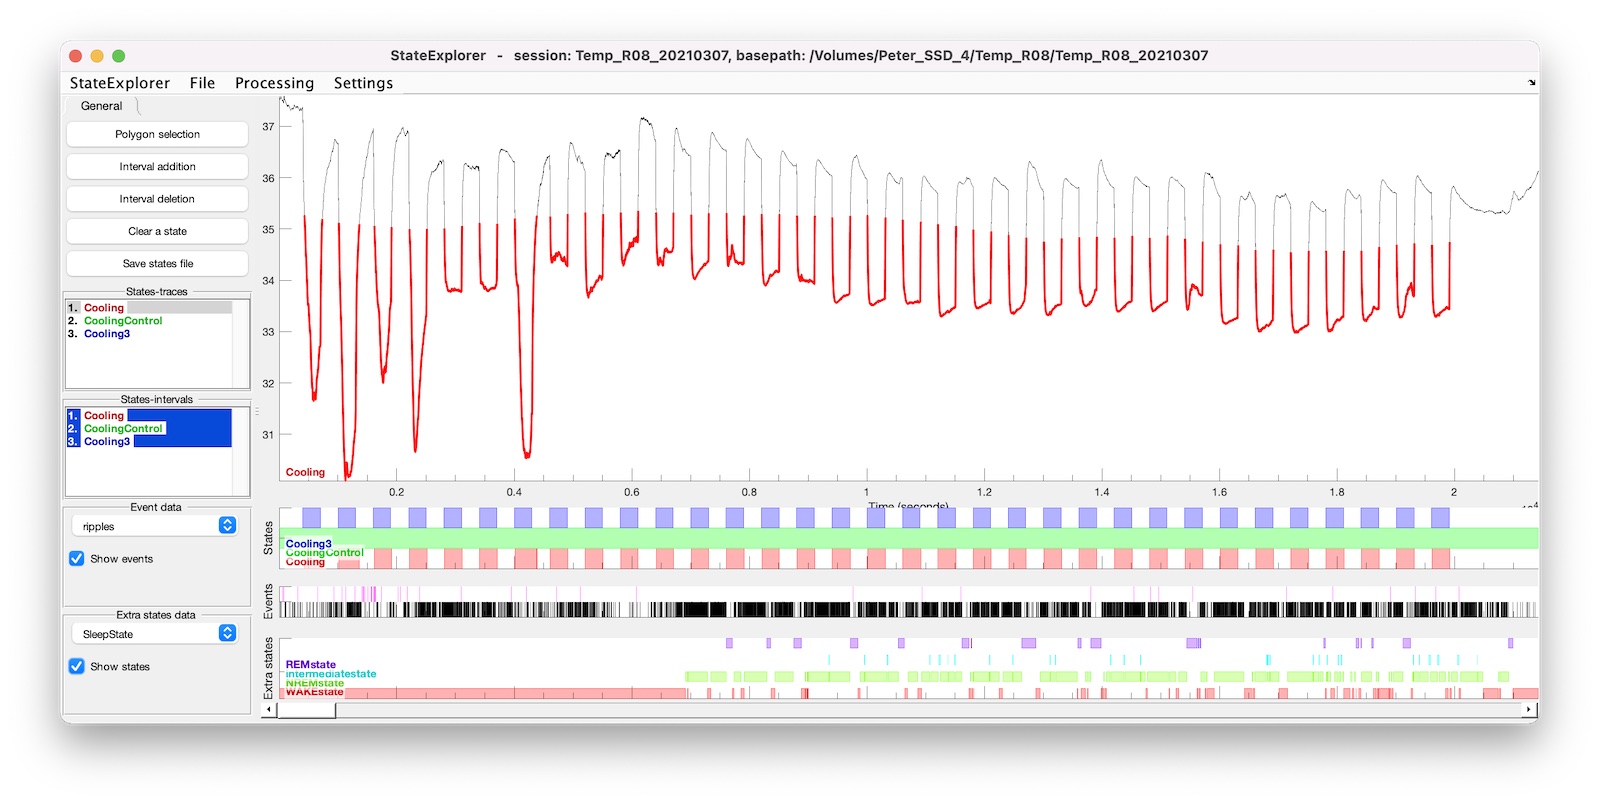
Events and states-data can also be shown in StateExplorer below the main plot
Loading data in StateExplorer
StateExplorer can be called without any input parameters. A dialog will be shown to the user, allowing for selection of a timeseries struct from the Matlab workspace or a timeseries mat file (basename.data.timeseries.mat) from the basepath:
StateExplorer
- You can also specify the data structure you would like to load, and :
timeseries_data = StateExplorer(timeseries_data)