Run various benchmarks as showed in Supplementary figure 5
Quit
Quit CellExplorer. This will save any manual curation to the output from the call, e.g. cell_metrics = CellExplorer('metrics',cell_metrics);. Closing the main window has the same effect.
File
Elements
Description
Load session from file
Opens a file dialog where you can select a cell metrics Matlab file to load
Save
Saves any manual curation to the original cell metrics files. This also works in batch mode, allowing you to save any changes back to the original cell metrics calculated per session.
Save As…
Save cell metrics to a new file.
Restore classification from backup
Shows a dialog with a list of backup steps for the current session. Choose any backup point to restore to that state. Every time the cell metrics are processed again with ProcessCellMetrics.m and curation are saved via CellExplorer, a backup is created. Backups are stored in a subfolder with the data
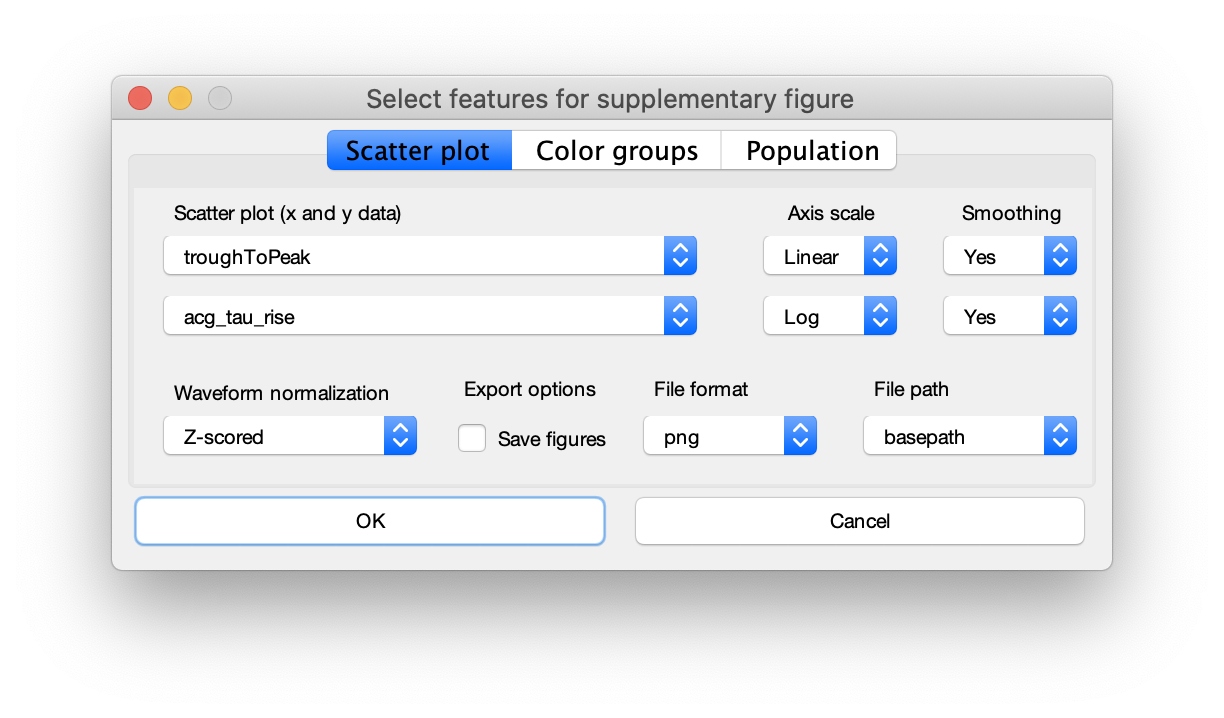
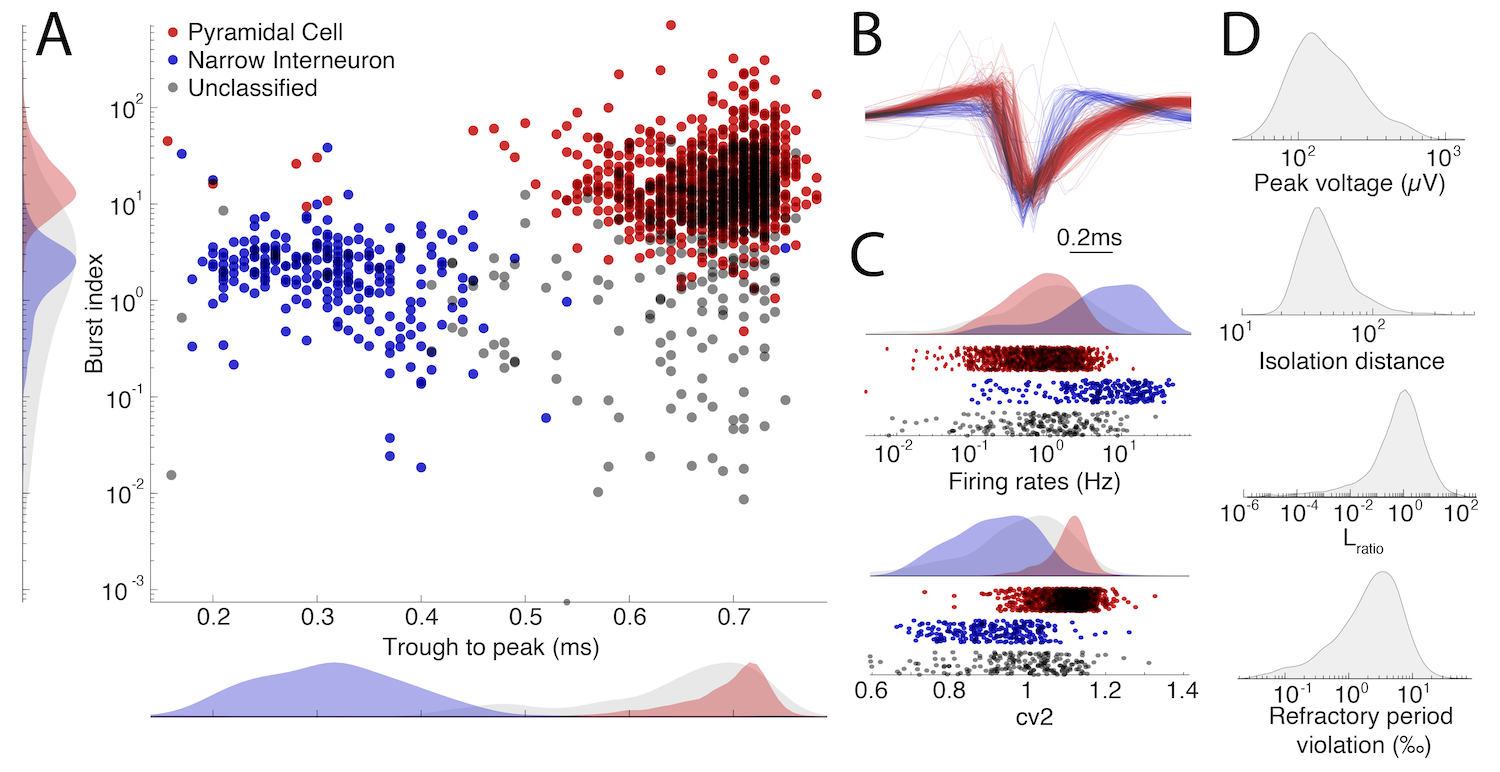
Generates a supplementary figure optimized for publication (see figures below with the dialog and supplementary figure). You can select which metrics to show in panels in C and D
Generate summary figure
Generates a summary figure, which is also generate by the processing module
Navigation
Elements
Description
Go to cell
Shows a dialog allowing you to provide a cell id or session to go to
Go to previously selected cell (backspace)
Go to previously selected cell
Cell Selection
Elements
Description
Polygon selection of cells from plots
Draw a polygon circling the points/lines in any of the plots to perform an action on the circled cells
Perform group action
Perform group action on selected cells. If no cells are currently selected, a selection dialog will be shown
Sticky cell selection
boolean: Cell the selection is kept: “sticky”
Reset sticky cell selection
Resets cell selection
Highlight cells by mouse over
boolean: whenever you move your cursor in any plot, a pop-up is shown for the nearest cell (relative to the cursor) in the plots with the cell’s id and group info (e.g. Cell type or other active grouping)
Classification
Elements
Description
Undo classification
Undoes the last manual curation step (any curation of these types are tracked: cell-types, labels, tags, groups, brain regions, ground truth classification, Deep-Superficial)
boolean: Waveforms are z-scored or shown in µV in the Waveforms (all) plot
Show waveform metrics
boolean: Show waveform metrics in the single waveform plots. Metrics include trough-to-peak, AB-ratio, trough-to-peak (derivative)
Channel map inset with waveforms
No channelmap/Single units/Trilateration of units: Shows a small channel map inset in the waveform plots
Show group colors in channel map inset
boolean: Show group colors in channel map inset
Show ACG inset with waveforms
boolean: Shows a small ACG inset in the waveform plot
Waveform alignment
Probe layout/Electrode groups
Waveform count across channels
All channels/Best channels Shows waveforms for all or only for the best channels
Trilateration group data
session/animal/all show trilaterated position of units from current session, from the same animal or from all sessions (only in batchmode). Only affects the trilateration position plot and not the Channel map inset in the waveforms plot
View
Elements
Description
Show regular Matlab menu bar
boolean Hides the CellExplorer menu and shows the regular Matlab figure menu bar
Show all traces
boolean All traces are shown instead of the default maximum of 2000 (on by default to increase performance)
Show legend in spikes plot
boolean Shows legend in spikes plot (off by default to increase performance)
Show linear fit in group plot
boolean Show a linear fit along thet 2D group data in the custom plot
Show legend in firing rate maps
boolean Show legend in firing rate maps (off by default to increase performance)
Show heatmap in firing rate maps
boolean Show heatmap of trials in firing rate maps (headmap or lines)
Shown colorbar in heatmaps in firing rate maps
boolean Show colorbar in heatmaps (off by default to increase performance)
ISI normalization
Rate/Occurrence/Instantaneous rate Alter the normalization and x-axis of the ISI plots
Raincloud plot normalization
Peak/Probability/Count Alter the normalization of the raincloud histogram curves
Generate significance matrix
Dialog allowing you to select a list of metrics for which a significance matrix will be generated as described here
Generate raincloud metrics figure
Dialog allowing you to select a list of metrics for which a raincloud plot will be generated for each of them as described here
Change marker size for group plots
Change the marker size in group plots: size 6-25 recommended.
Change colormap
Dialog allowing you to change the colormap
Change metric used for sorting image data
Dialog allowing you to change the metric used to sort cells in image data
Change metrics used for t-SNE plot
Dialog allowing you to change the metrics, parameters and recalculate the t-SNE data
Flip x and y axes in the custom plot
Flips selected x and y metrics for the custom plot
ACG
Elements
Description
ACG time scale
30ms/100ms/1sec/Log10: adjusts the timescale of the ACG plots
boolean Show monosynaptic connections in the custom plot
Show in classic plot
boolean Show monosynaptic connections in the classic plot
Show in t-SNE plot
boolean Show monosynaptic connections in the t-SNE plot
Plot excitatory connections
boolean Show excitatory monosynaptic connections
Plot inhibitory connections
boolean Show inhibitory monosynaptic connections
Synaptic filter
None/Selected/Upstream/Downstream/Up & Downstream /All: Which monosynaptic connection types to show.
Highlight excitatory cells
boolean Highlight excitatory cells with triangles
Highlight inhibitory cells
boolean Highlight inhibitory cells with squares
Highlight cells receiving excitatory input
boolean Highlight cells receiving excitation with downward facing triangles
Highlight cells receiving inhibitory input
boolean Highlight cells receiving inhibition with asterisks
Shown hollow gaussian in CCG plots
boolean Show the significance level for the monosynaptic connections in the CCG plots (determined from a hollow gaussian)
Adjust monosynaptic connections
adjust monosynaptic connections for the current session using the gui_MonoSyn.m as described in the Monosynaptic connections tutorial
Reference data
Elements
Description
Reference data plotting options
No reference truth data/Image data/Scatter data/Histogram data Options described here
Opens reference data dialog
Opens the reference data dialog as described here and in this tutorial
Adjust bin count for reference and ground truth plots
Adjust the bin count (default: 100) for image and histogram representations
Explore reference data
Replaces current cell metrics data with the loaded reference data, allowing you to explore these cells natively in CellExplorer
Ground truth
Elements
Description
Ground truth plotting options
No ground truth data/Image data/Scatter data/Histogram data Options described here
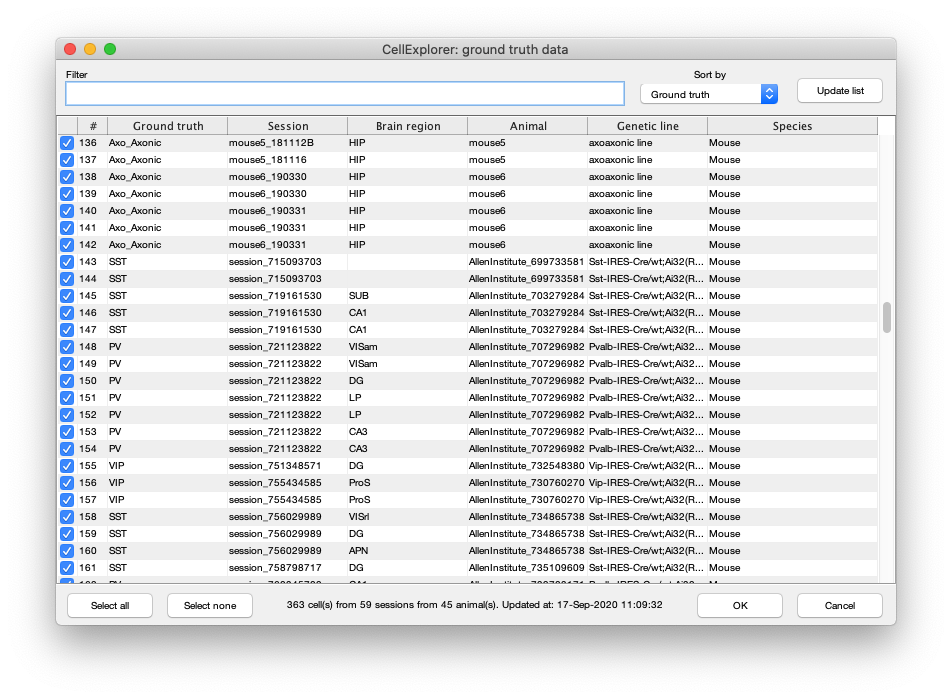
Opens ground truth data dialog
Opens the ground truth dialog as described in this tutorial (dialog shown below)
Adjust bin count for reference and ground truth plots
Adjust the bin count (default: 100) for image and histogram representations
Show ground truth classification tab
Shows a tab with a list of ground truth cell-types in the right side-panel for manual curation (tagging). Please see this Opto-tagging tutorial to learn more
Replaces current cell metrics data with the loaded ground truth data, allowing you to explore these cells natively in CellExplorer
Group data
Elements
Description
Open group data dialog
Shows the group data window for groups/tags/groundTruthClassification. Group data can be selected, edited, highlighted, used as filters and actions can be performed from them.
Generate filters from group data
Takes group data (groups/tags/groundTruthClassification) and generates filters from them (check the drop-down in the left side panel in Group data and filters). Original group data can be overlapping, where a given cell can belong to many groups. If the filters generated, this is not preserved. Three new filter groups are created: groups_from_tags, groups_from_groups and groups_from_groundTruthClassification
Table data
Elements
Description
Table data type
Cell metrics/Cell list/None: Show cell metrics (full list of metrics and values) for current cell or list of cells (list of cells with a check box, id and two metrics for each cell) in table
Cell list metrics #1 and #2
If cell list is shown in table, you can select what metrics to show in the list
Cell list sorting
multiple options The metric used to sort the cells in the table
Shows the database dialog with list of sessions with calculated cell metrics.
Edit credentials
Open the database credentials file db_credentials.m, where you can define your Buzsaki lab databank credentials
Edit repository paths
Open the database credentials file db_local_repositories.m, where you can define the local paths to data repositories used by CellExplorer and the database tools
View current session on website
Shows the current session in the Buzsaki lab databank in your browser
View current animal subject on website
Shows the current animal subject in the Buzsaki lab databank in your browser
Help
Elements
Description
Keyboard shortcuts
Shows a window with the list of keyboard shortcuts