Spike and event data
 CellExplorer is capable of loading the raw spike and event data which allows for creating custom raster plots and histograms from the raw spike and events. Please see the tutorial on spike data to learn more.
 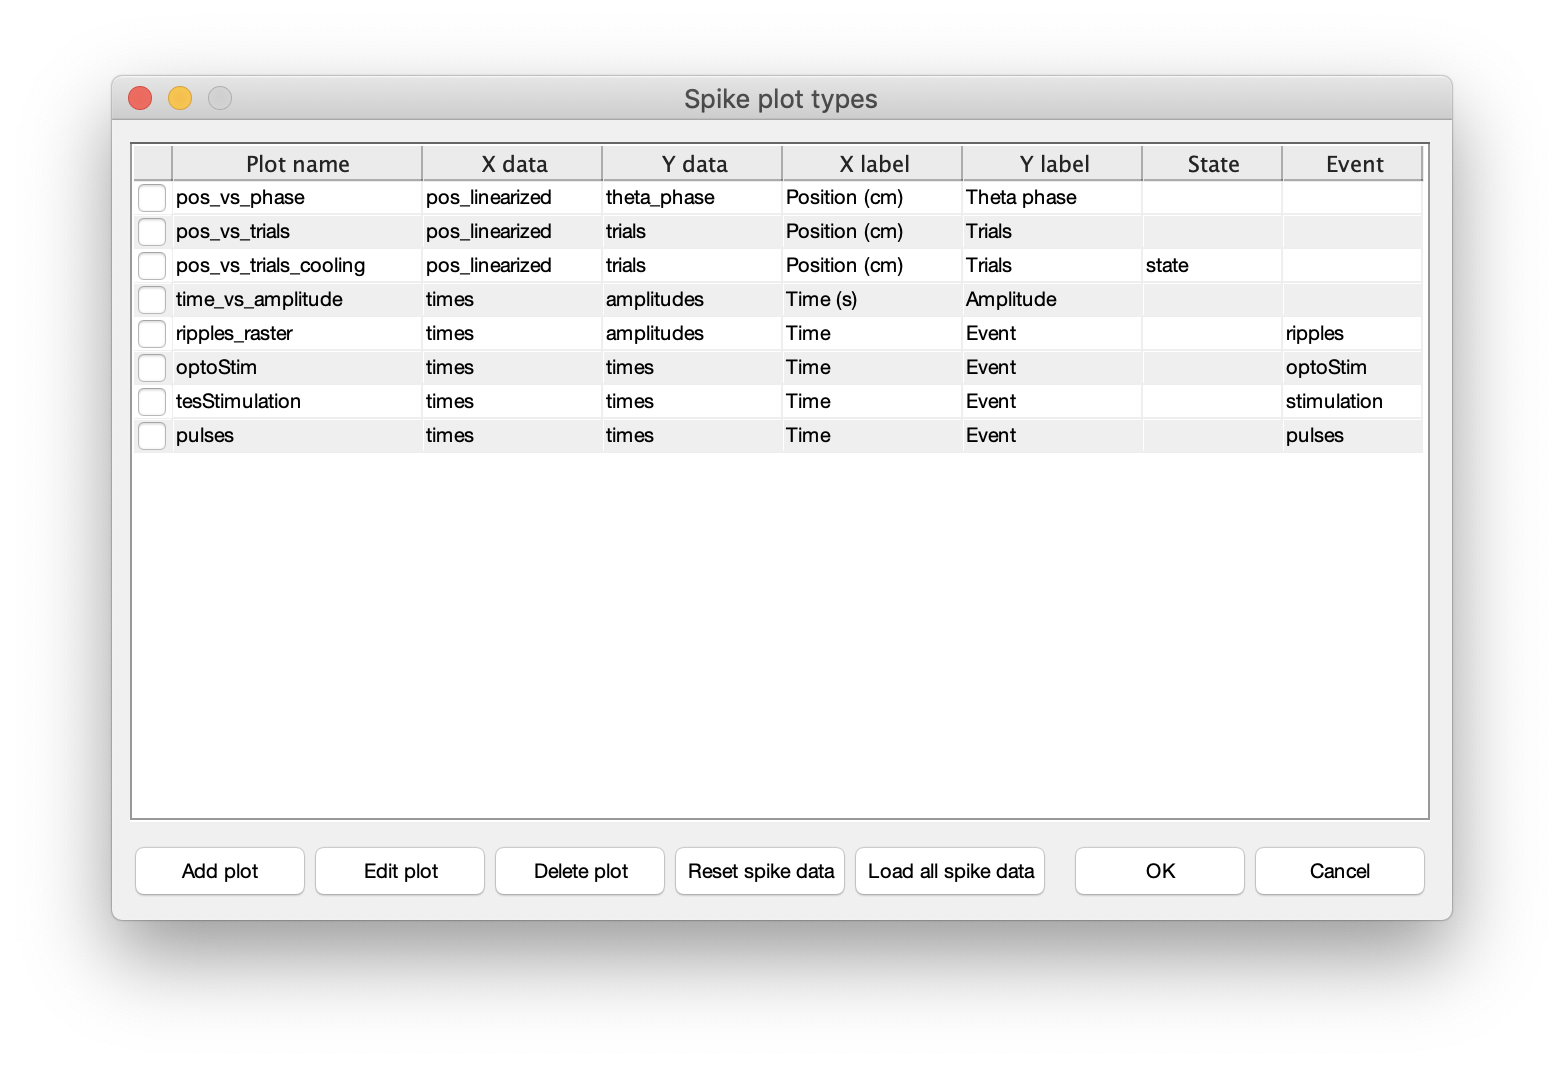 You can define spike raster plots directly in CellExplorer using above dialog, or you can save custom plots that are loaded automatically in CellExplorer. Custom spike raster plots are located in
 +customSpikesPlots/. There is a spikes_template available to get you started:
function spikePlot = spikes_template
% This is a example template for creating your own custom spike raster plots
%
% OUTPUT
% spikePlot: a struct containing all settings
% Spikes struct parameter
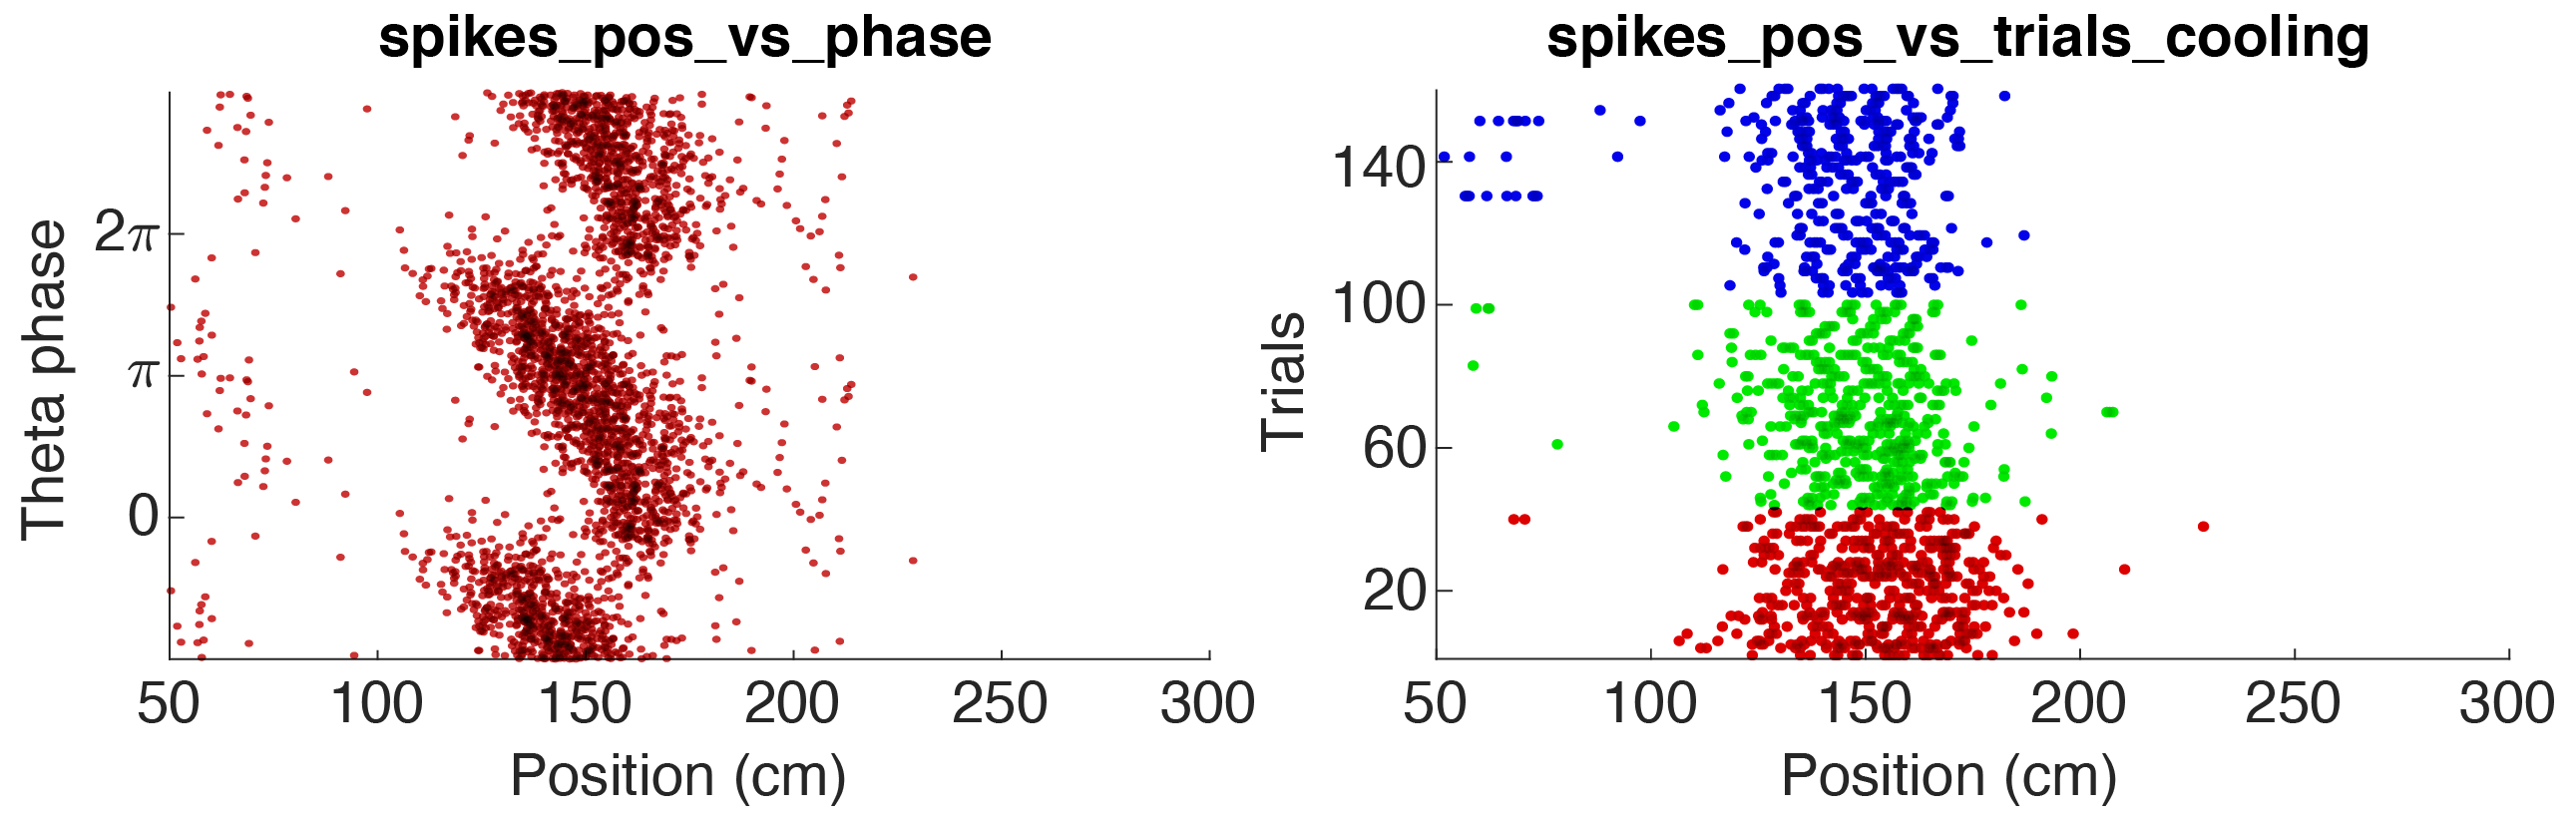
spikePlot.x = 'pos_linearized'; % x data
spikePlot.y = 'theta_phase'; % y data
spikePlot.x_label = 'Position (cm)'; % x label
spikePlot.y_label = 'Theta phase'; % y label
spikePlot.state = ''; % state data [ideally integer]
spikePlot.filter = 'speed'; % any data used as filter
spikePlot.filterType = 'greater than'; % [none, equal to, less than, greater than]
spikePlot.filterValue = 20; % filter value
% Event related parameters (if applicable)
spikePlot.event = '';
spikePlot.eventType = 'events'; % [events,manipulation,states]
spikePlot.eventAlignment = 'peak'; % [onset, offset, center, peak]
spikePlot.eventSorting = 'amplitude'; % [none, time, amplitude, duration]
spikePlot.eventSecBefore = 0.2; % in seconds
spikePlot.eventSecAfter = 0.2; % in seconds
spikePlot.plotRaster = 0; % [binary] show raster
spikePlot.plotAverage = 0; % [binary] show average response
spikePlot.plotAmplitude = 0; % [binary] show amplitude for each event on a separate y-axis plot
spikePlot.plotDuration = 0; % [binary] show event duration for each event on a separate y-axis plot
spikePlot.plotCount = 0; % [binary] show spike count for each event on a separate y-axis plot
end
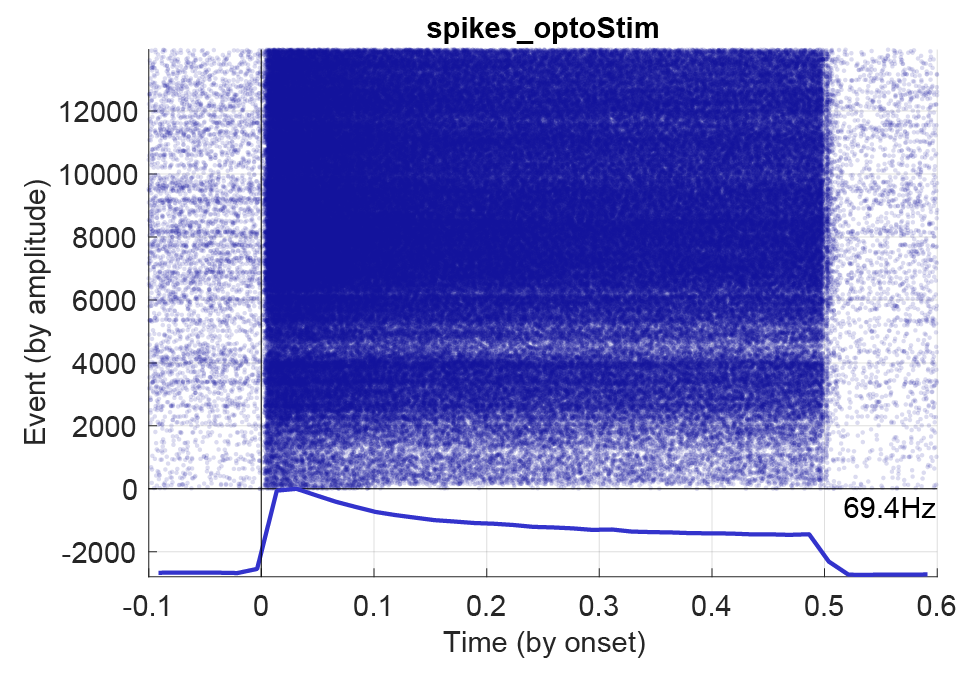
Below figure shows a PSTH for an opto-stimulated interneuron with 1200 events and a stimulation window of 0.5 seconds.