Capabilities
CellExplorer is a graphical user interface that allow you to explore your data on a single cell level. Each of the plots are interactive using your mouse and keyboard.
Table of contents
- Classification
- Monosynaptic connections
- Interface for deep-superficial classification curation
- Reference data
- Raincloud plot
- Significance matrix
- Share cell metrics in your publications or with your peers
- Export figures
- Export supplementary figure
- Work in batch-mode while handling metrics on a single session level
- Track changes and autosave
Classification
You can do direct classification in the GUI. The following types of classification can be performed.
- Putative cell type: You can create new cell types directly in the GUI.
- Brain region: Allen institute atlas.
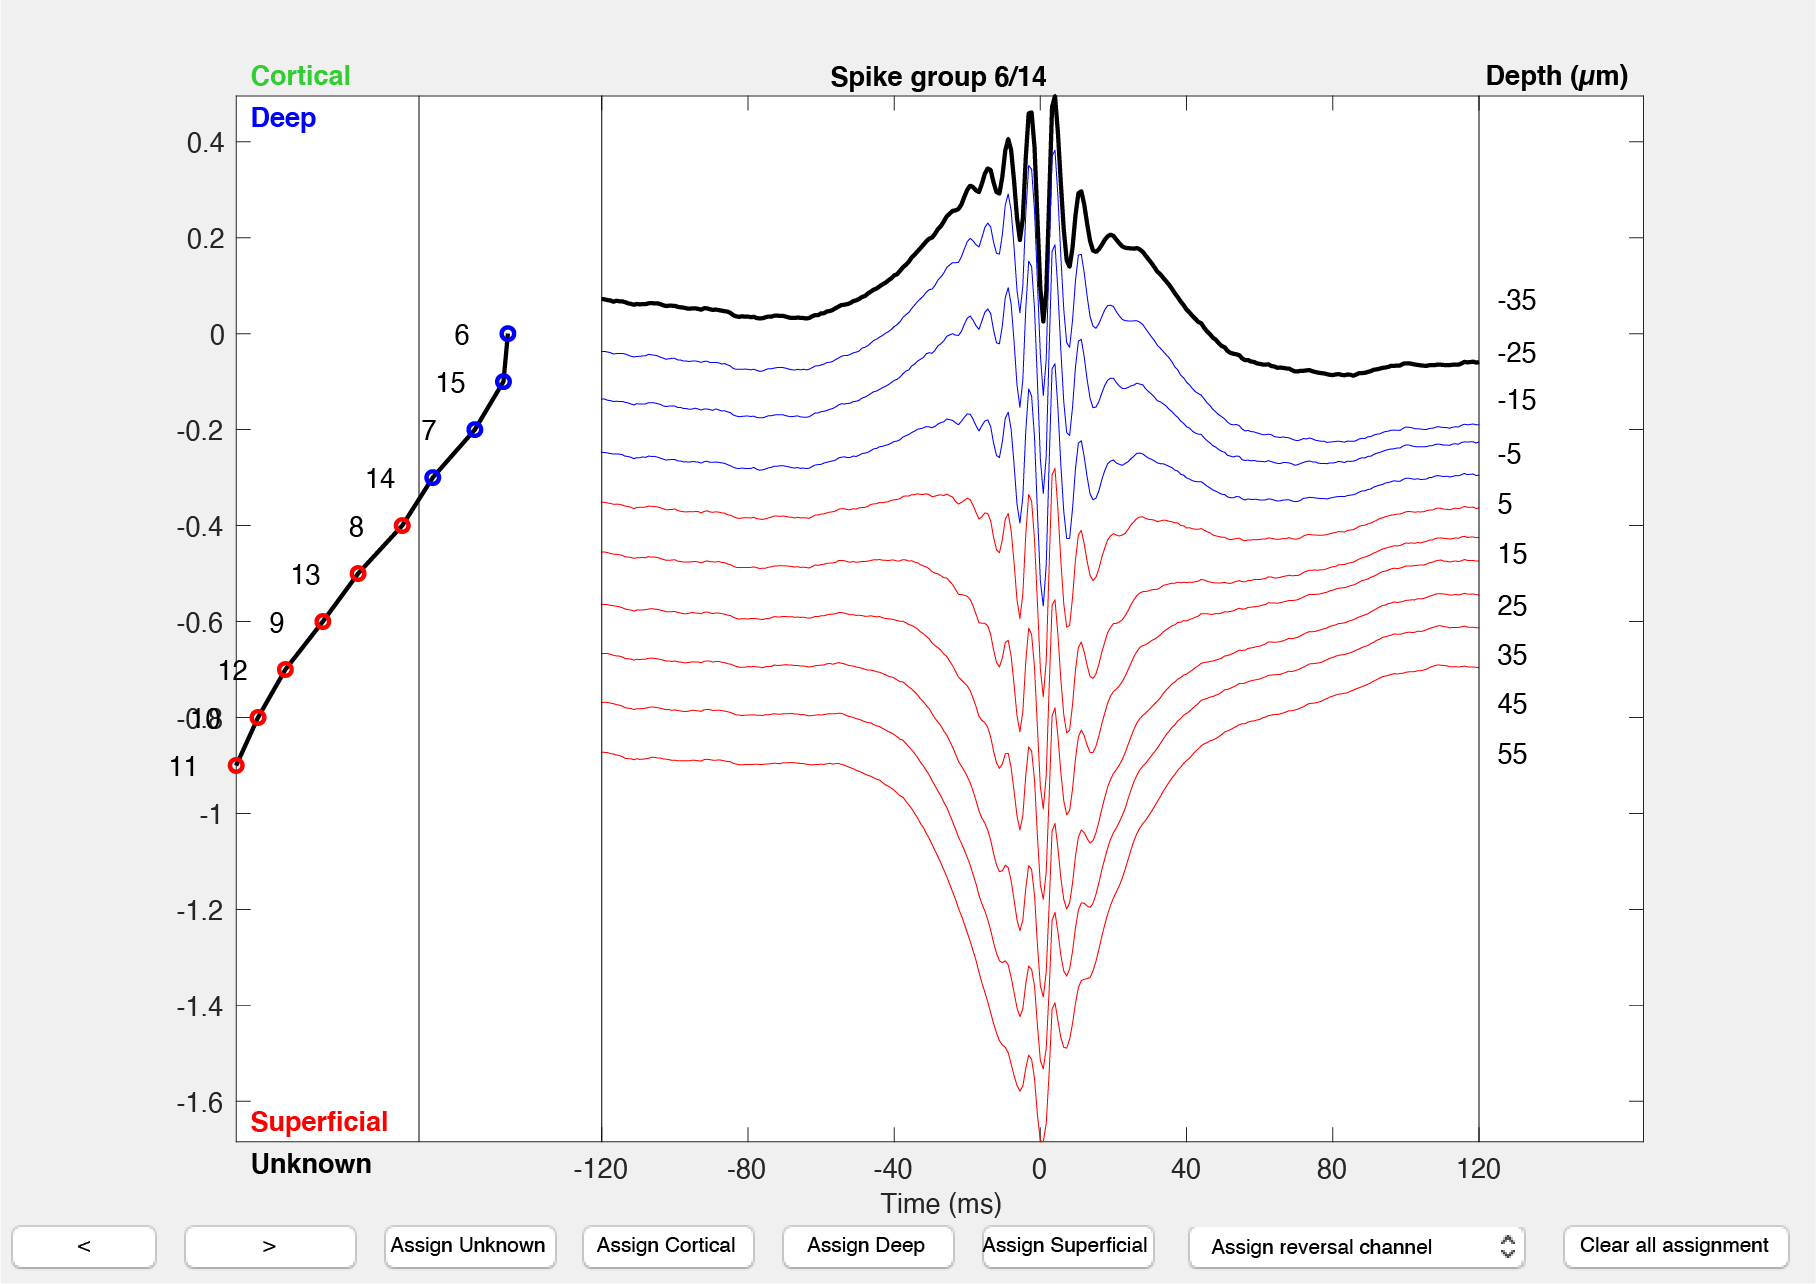
- Deep-superficial: Deep superficial assignment can be done in CellExplorer cell-wise and in a separate gui channel-wise.
- Labels: You can assign your own labels to any cell.
- Tags: Tags can be assigned.
- Groups: Groups can be created.
- Ground truth cell types: Ground truth data can be analysed directly in the GUI.
Monosynaptic connections
Monosynaptic connections are determined in the pipeline, and you can visualize the connections in the GUI and redo the manual curation directly from the GUI. You can adjust connections from CellExplorer by launching the monosyn interface. Please see the tutorial on manual curation of monosynaptic connections. 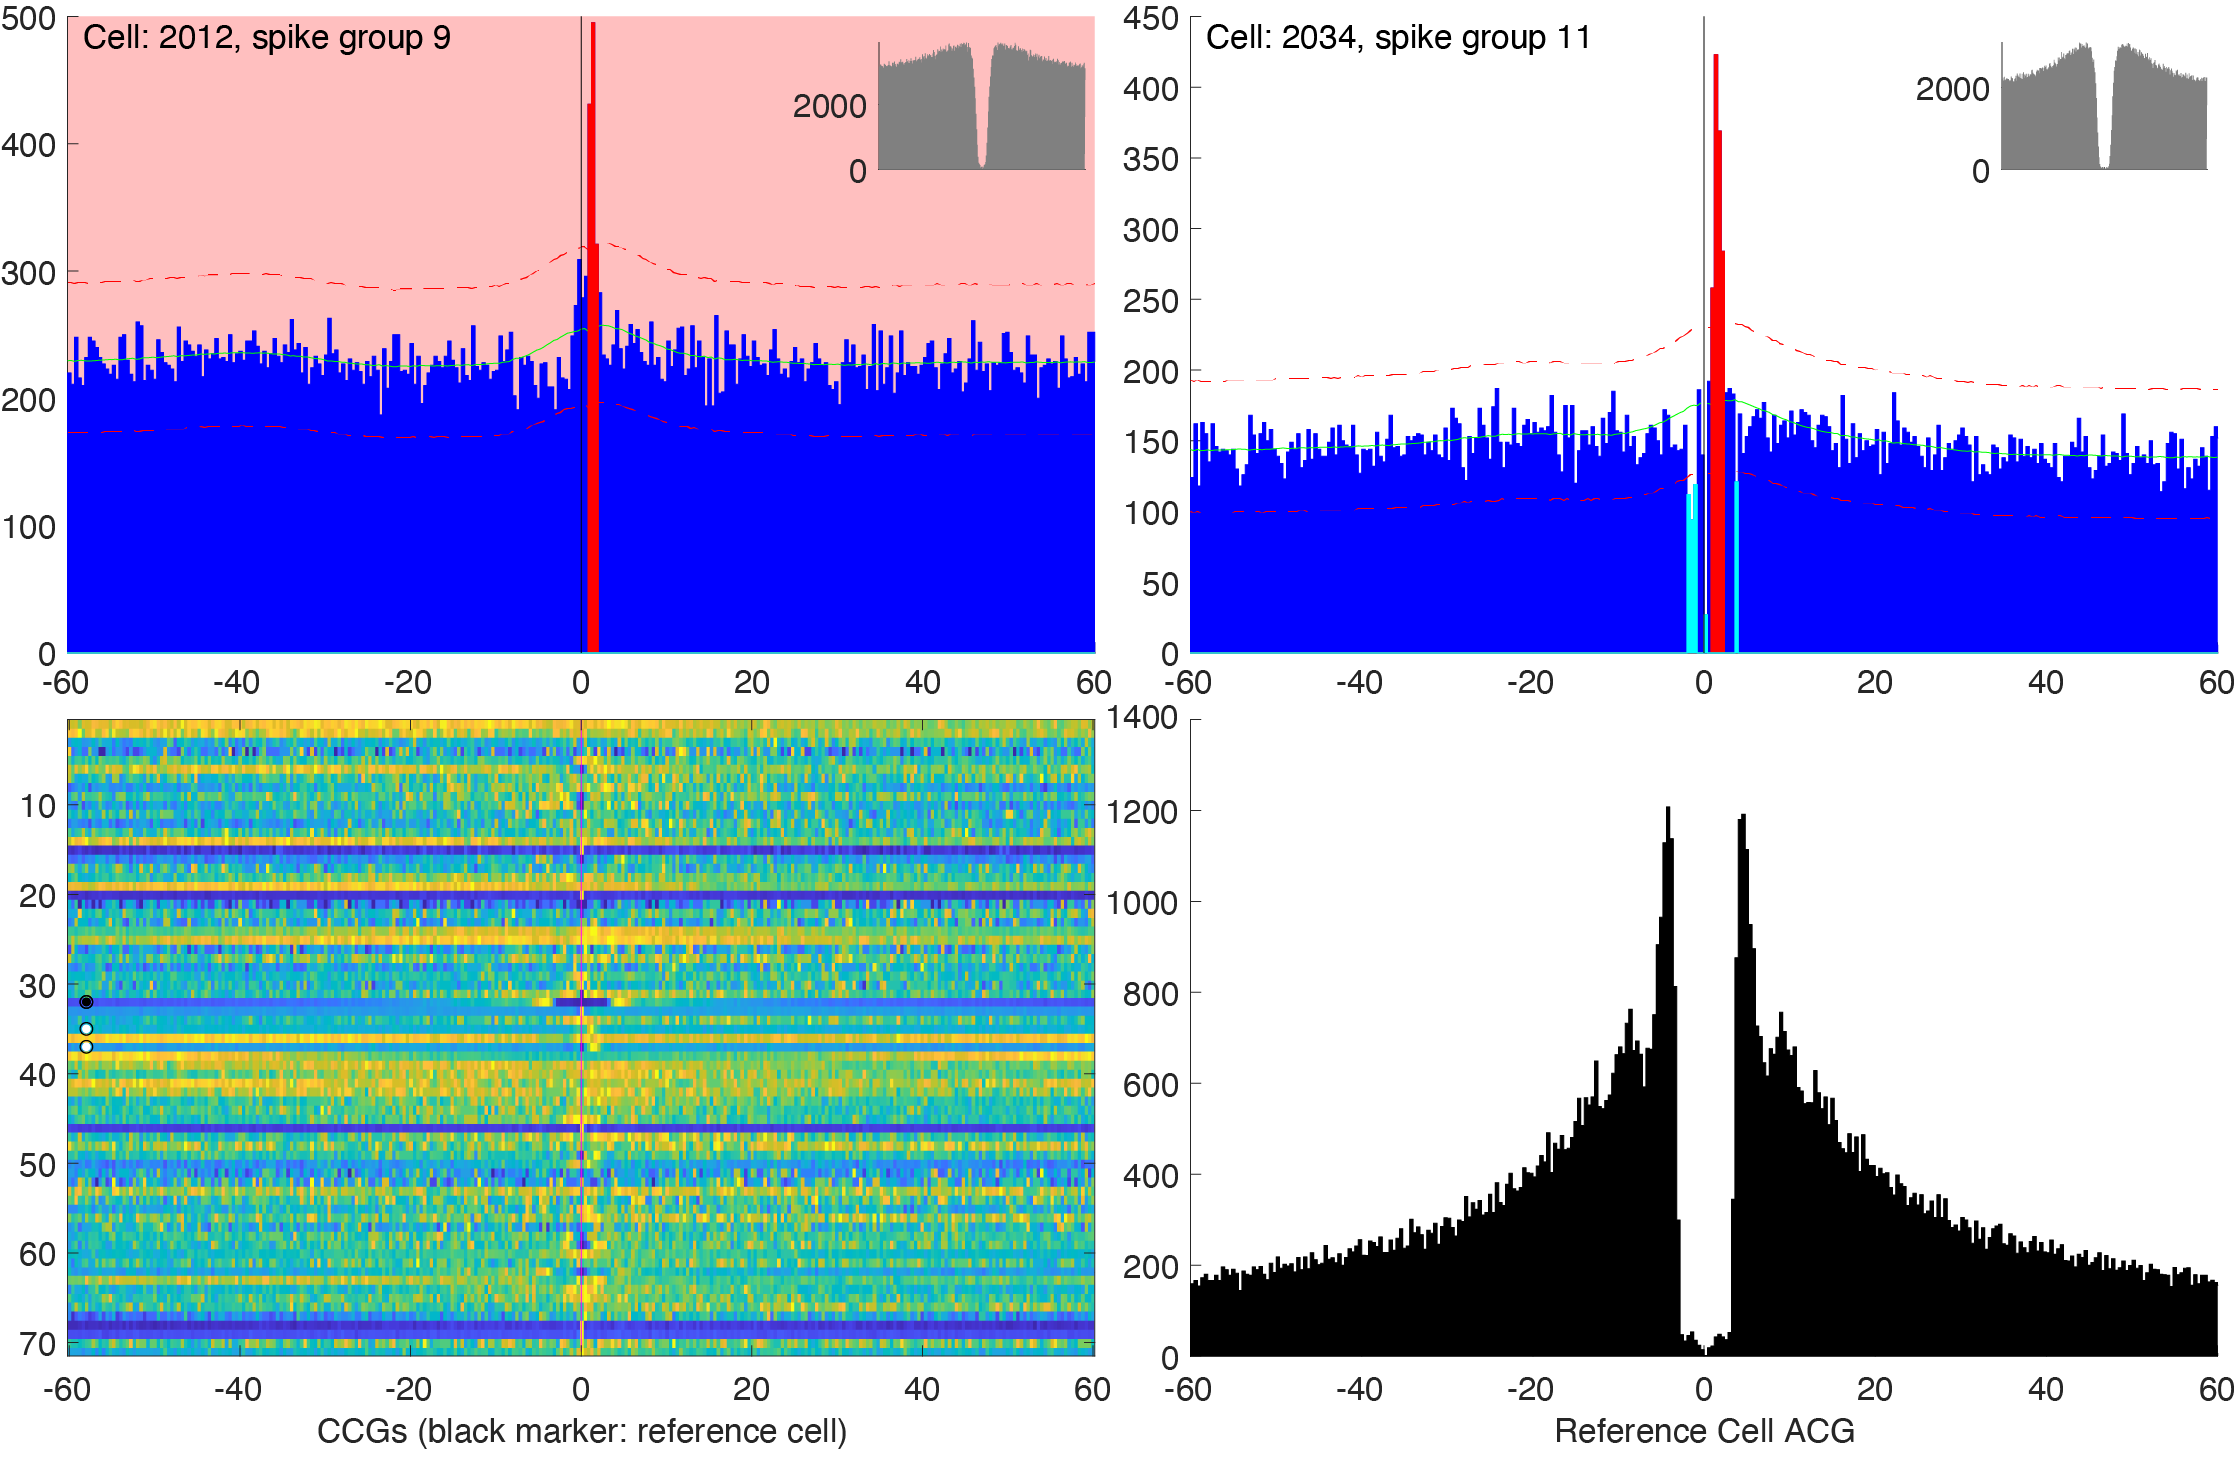
Interface for deep-superficial classification curation
Reference data
To help you characterize your own data, you can load reference data provided by our lab.
Raincloud plot
To quantify single dimensional variations in your data you can generate a raincloud plot. You can generate the plot from the top menu View -> Generate rain cloud metrics plot.
The comparison line widths signify significance levels, linewidth=1 signifies p>0.05, linewidth=2 signifies p<0.05 and linewidth=3 signifies p<0.001. Significance levels is determined using Two-sample Kolmogorov-Smirnov test (a non-parametric hypothesis test). You can generate a raincloud plot from any color grouping, e.g. cell types, deep-superficial or animal.
Below plot shows a raincloud a comparison across putative cell types: 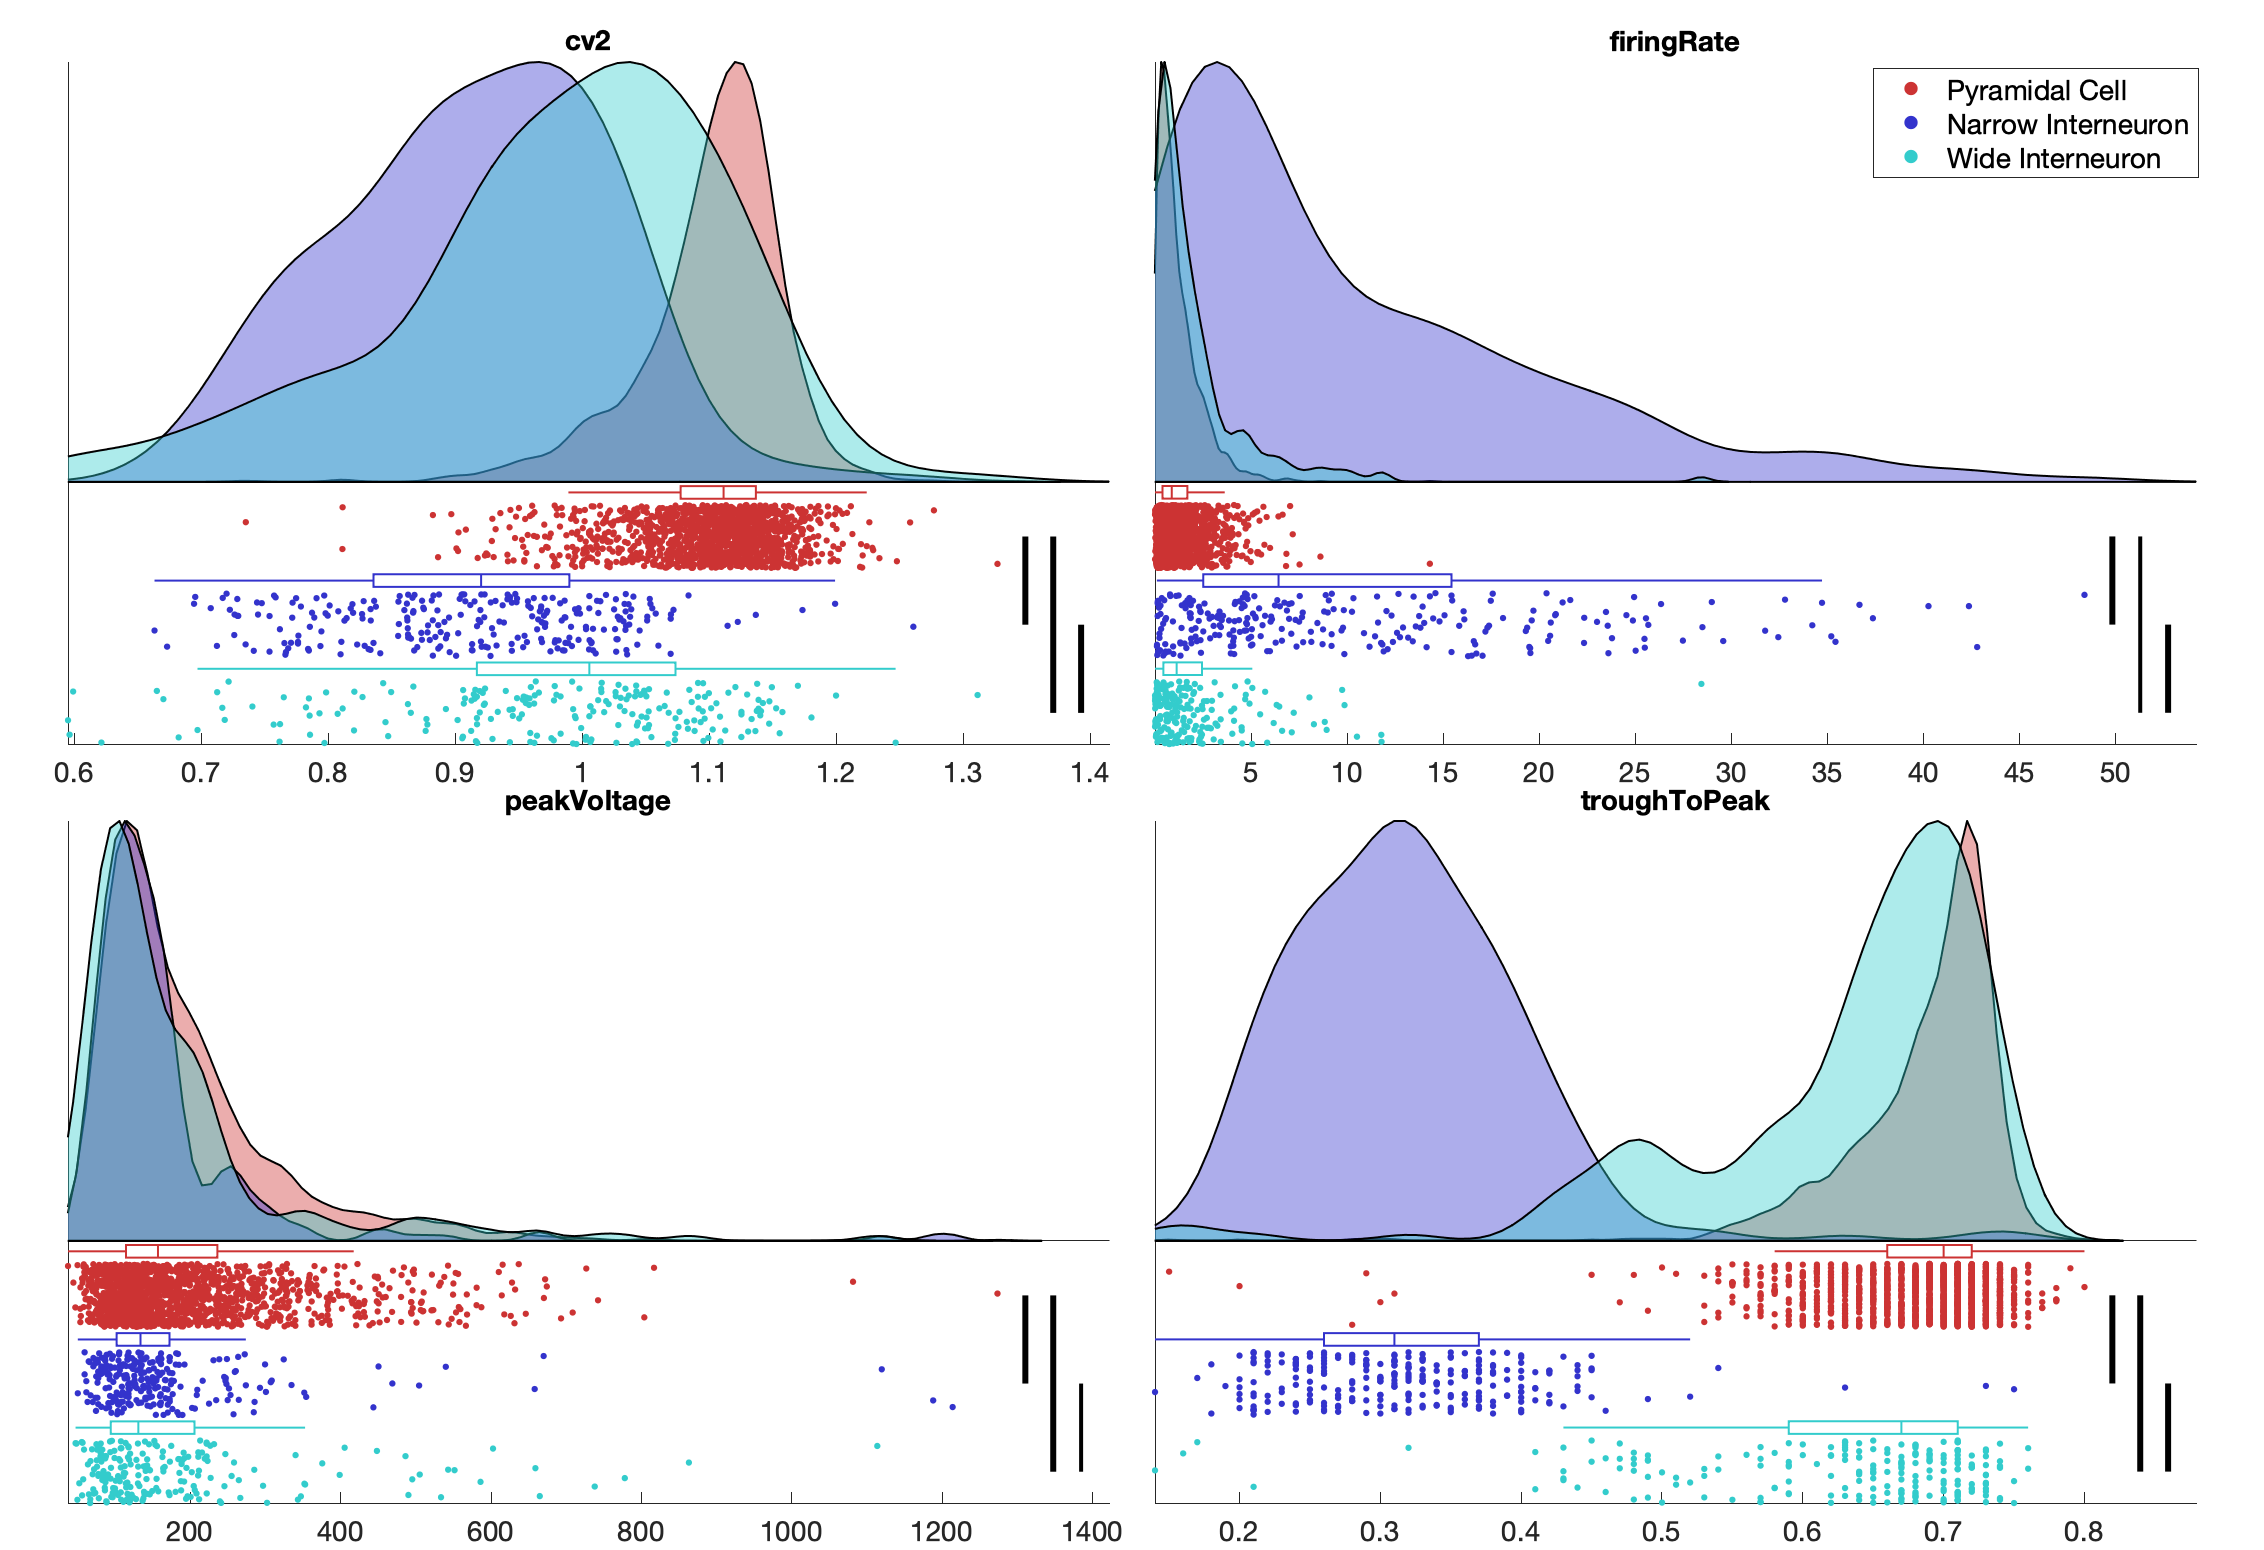
Significance matrix
The significance matrix can help quantify the modality of your data, e.g. using the deep-superficial labels or the cell types. You can generate the plot from the top menu View -> Generate significance matrix or by pressing K. Please select a group of size 2 beforehand. This will show a dialog for selecting which metrics to process.
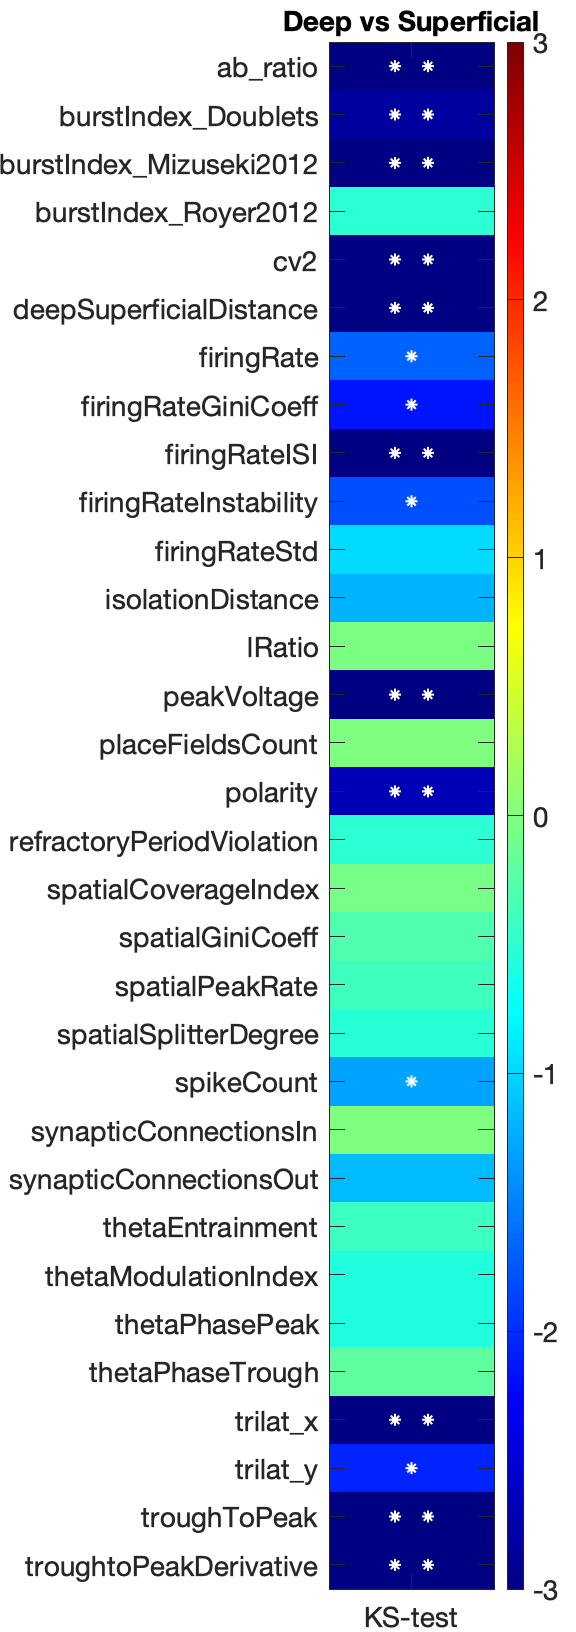
The colors in the matrix signify significance level (right color bar in log10), * signifies p<0.05 and ** signifies p<0.001. Selected metrics are shown on the left side of the matrix. Significance levels is determined using Two-sample Kolmogorov-Smirnov test (a non-parametric hypothesis test).
Share cell metrics in your publications or with your peers
You can save your combined cell metrics from a study into a single mat file that can be shared together with a publication. This allows peers to verify your classification or use your cell metrics directly. You can save the mat file from CellExplorer from the menu File -> Save.
Export figures
Figures can be exported using the GUI, either the main CellExplorer window or through cell selection actions dialog. For more information please see the figure export tutorial.
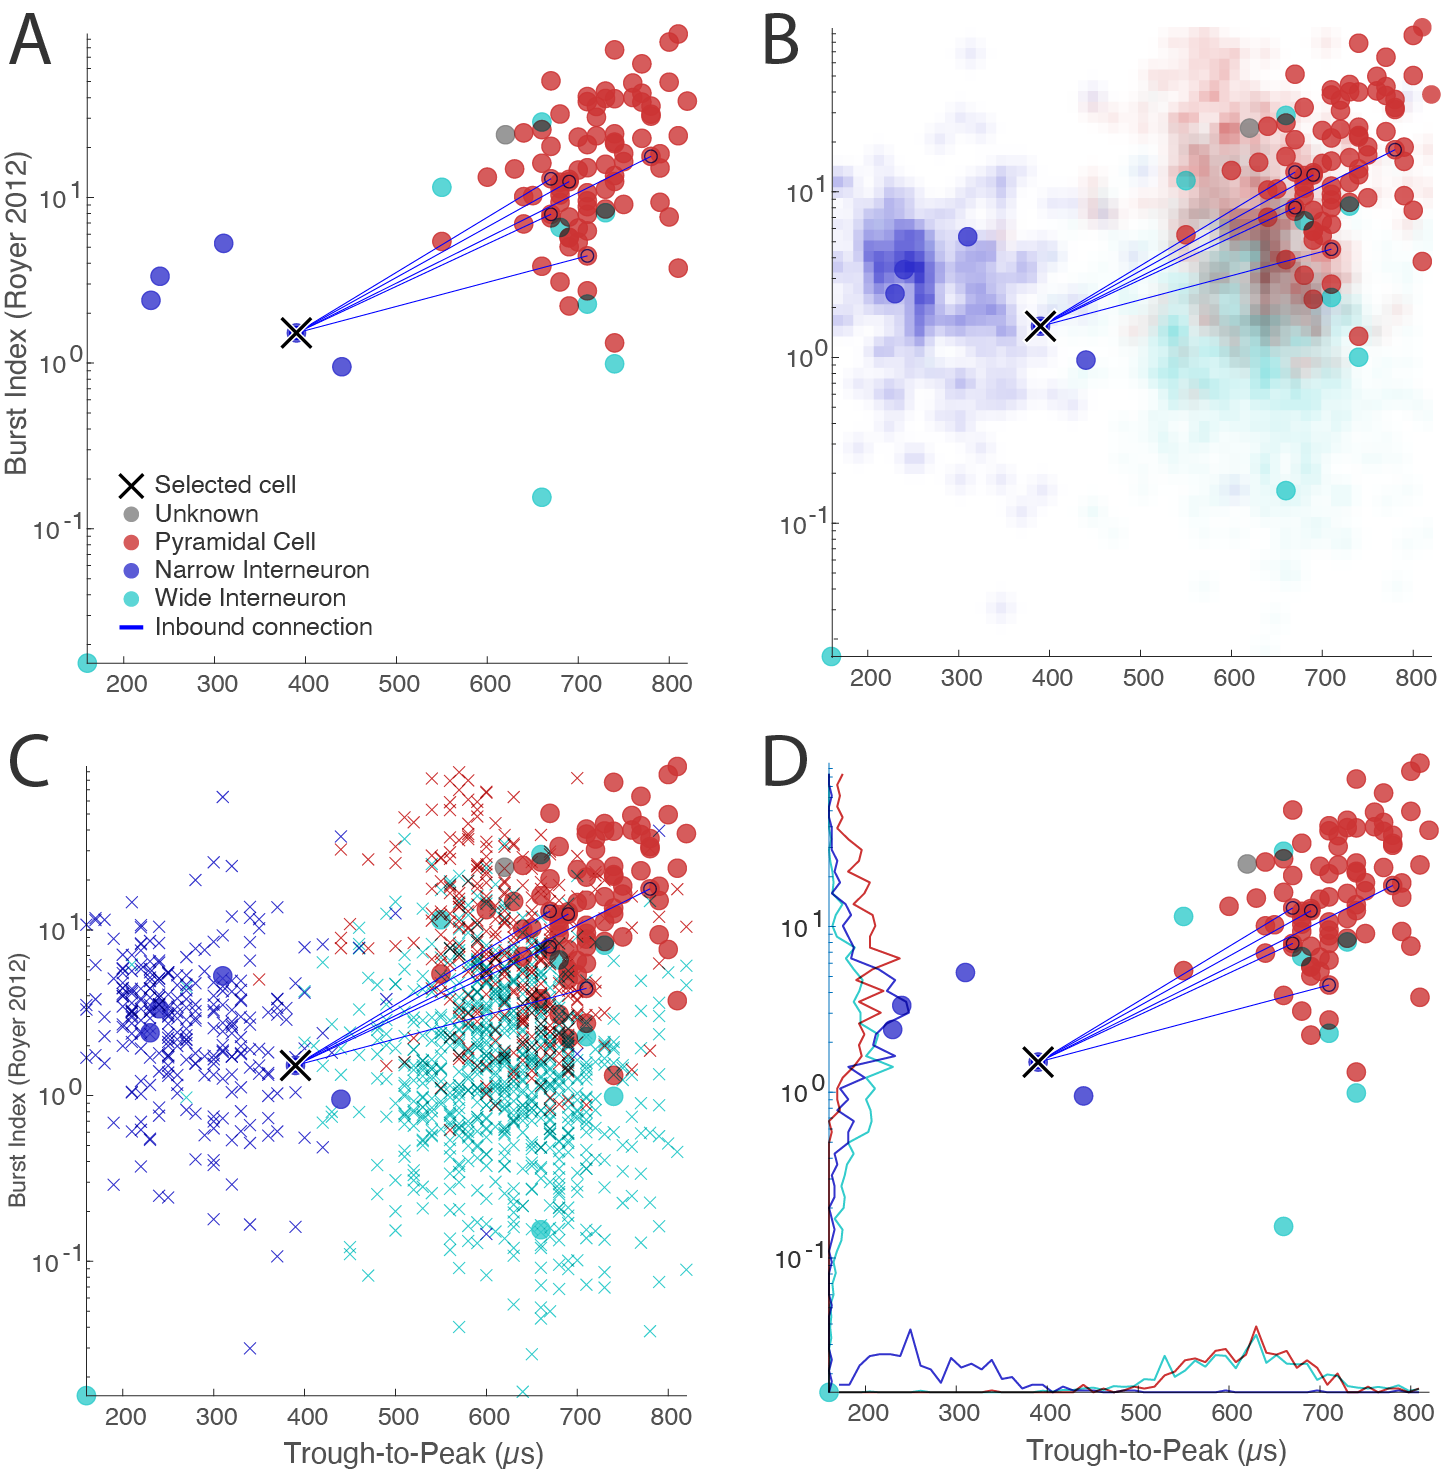
Export supplementary figure
A supplementary figure can be created for publications as shown below. From the menu select File -> Generate supplementary figure. The figure is customizable, allowing you to select the metric to show in each scatter and histogram plot. 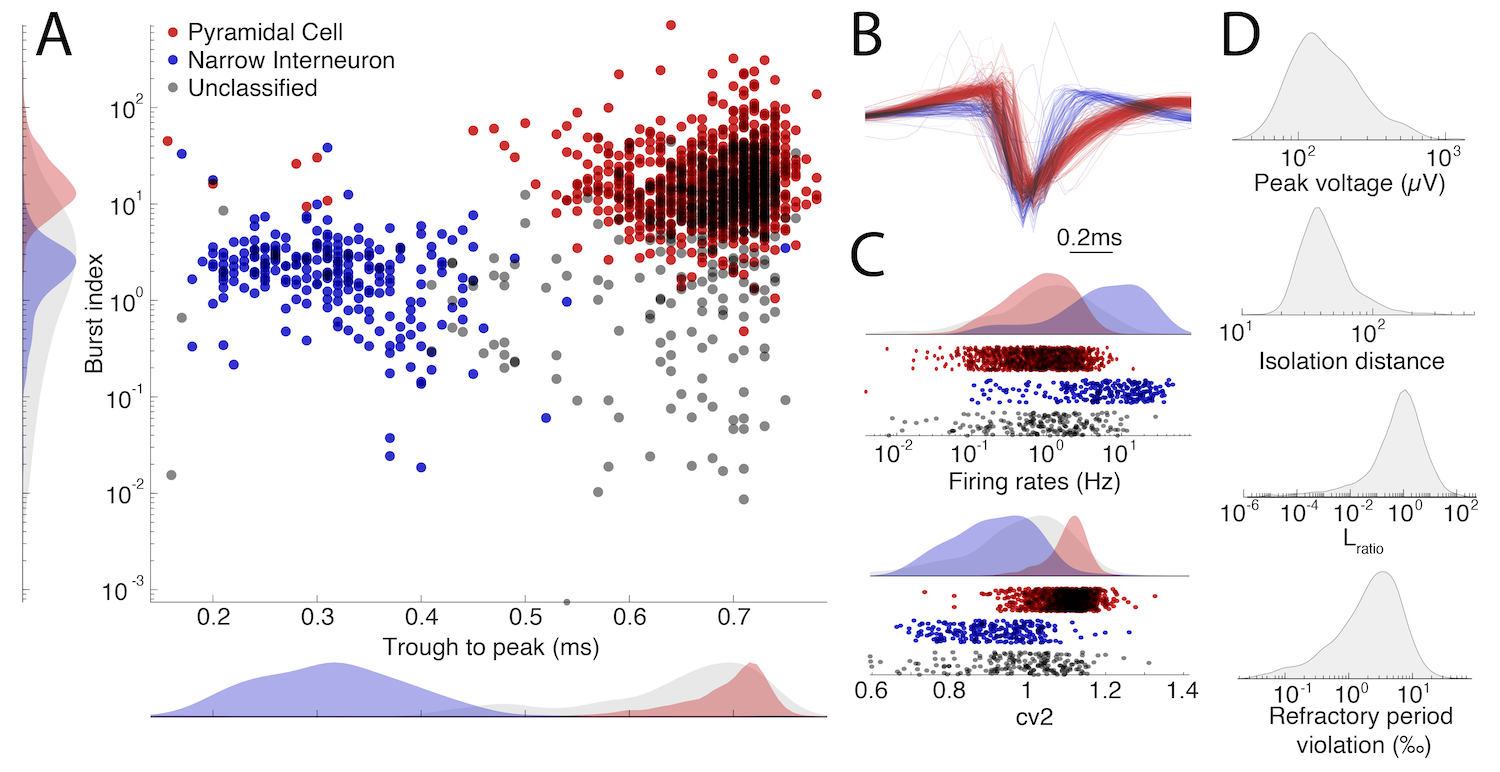
Work in batch-mode while handling metrics on a single session level
CellExplorer can handle batches of sessions. It will load metrics into one struct allowing you to visualize and classify your data across recordings and classify cells across sessions, while still maintaining the data handling on a single session level, writing your changes back to the original files. You can save metrics from a batch of sessions, and still load the data back into CellExplorer.
Track changes and autosave
CellExplorer tracks user-actions, which includes cell-type classifications, deep-superficial assignment, brain regions, labels, tags, groups and ground truth classifications. Reverse most recent action by pressing ctrl+Z. Further it autosaves your actions to your workspace every 6th action (You can turn the autosave feature off or adjust the autosave-interval in preferences). You still have to save your changes to the original cell_metrics file through the interface.