Tutorial on reference data
The Buzsaki lab is sharing a large set of datasets and a large set of these sessions are also shared with cell metrics that can be downloaded and displayed directly in CellExplorer. Learn more about our public data here. This tutorial will guide you through the process of using reference data in the manual curation process and for comparison with your own data.
- Launch CellExplorer
- Select
Reference data->Define reference datafrom the top menu. Below dialog will be shown in CellExplorer.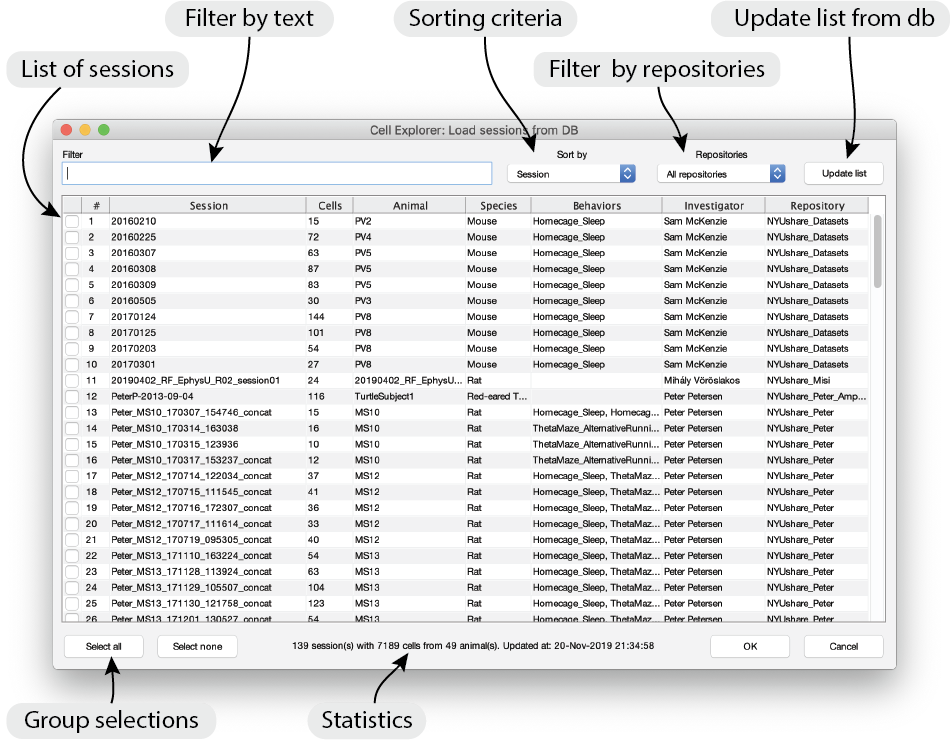
- Select the sessions you want to load. You can apply filters, change the sorting for easier selection. All data located at the repository
NYUshare_Datasetsare publicly available and will be downloaded to your computer upon request. For sessions located on private data repositories, you have to specify the local path the the repository in the filedb_local_repositories - Press OK and the sessions will be loaded from the repository paths to the local CellExplorer directory
referenceData/. Session on NYUshare_Datasets will be downloaded automatically to the same directory. - The reference data can be displayed in CellExplorer in three ways (all color coded by cell types):
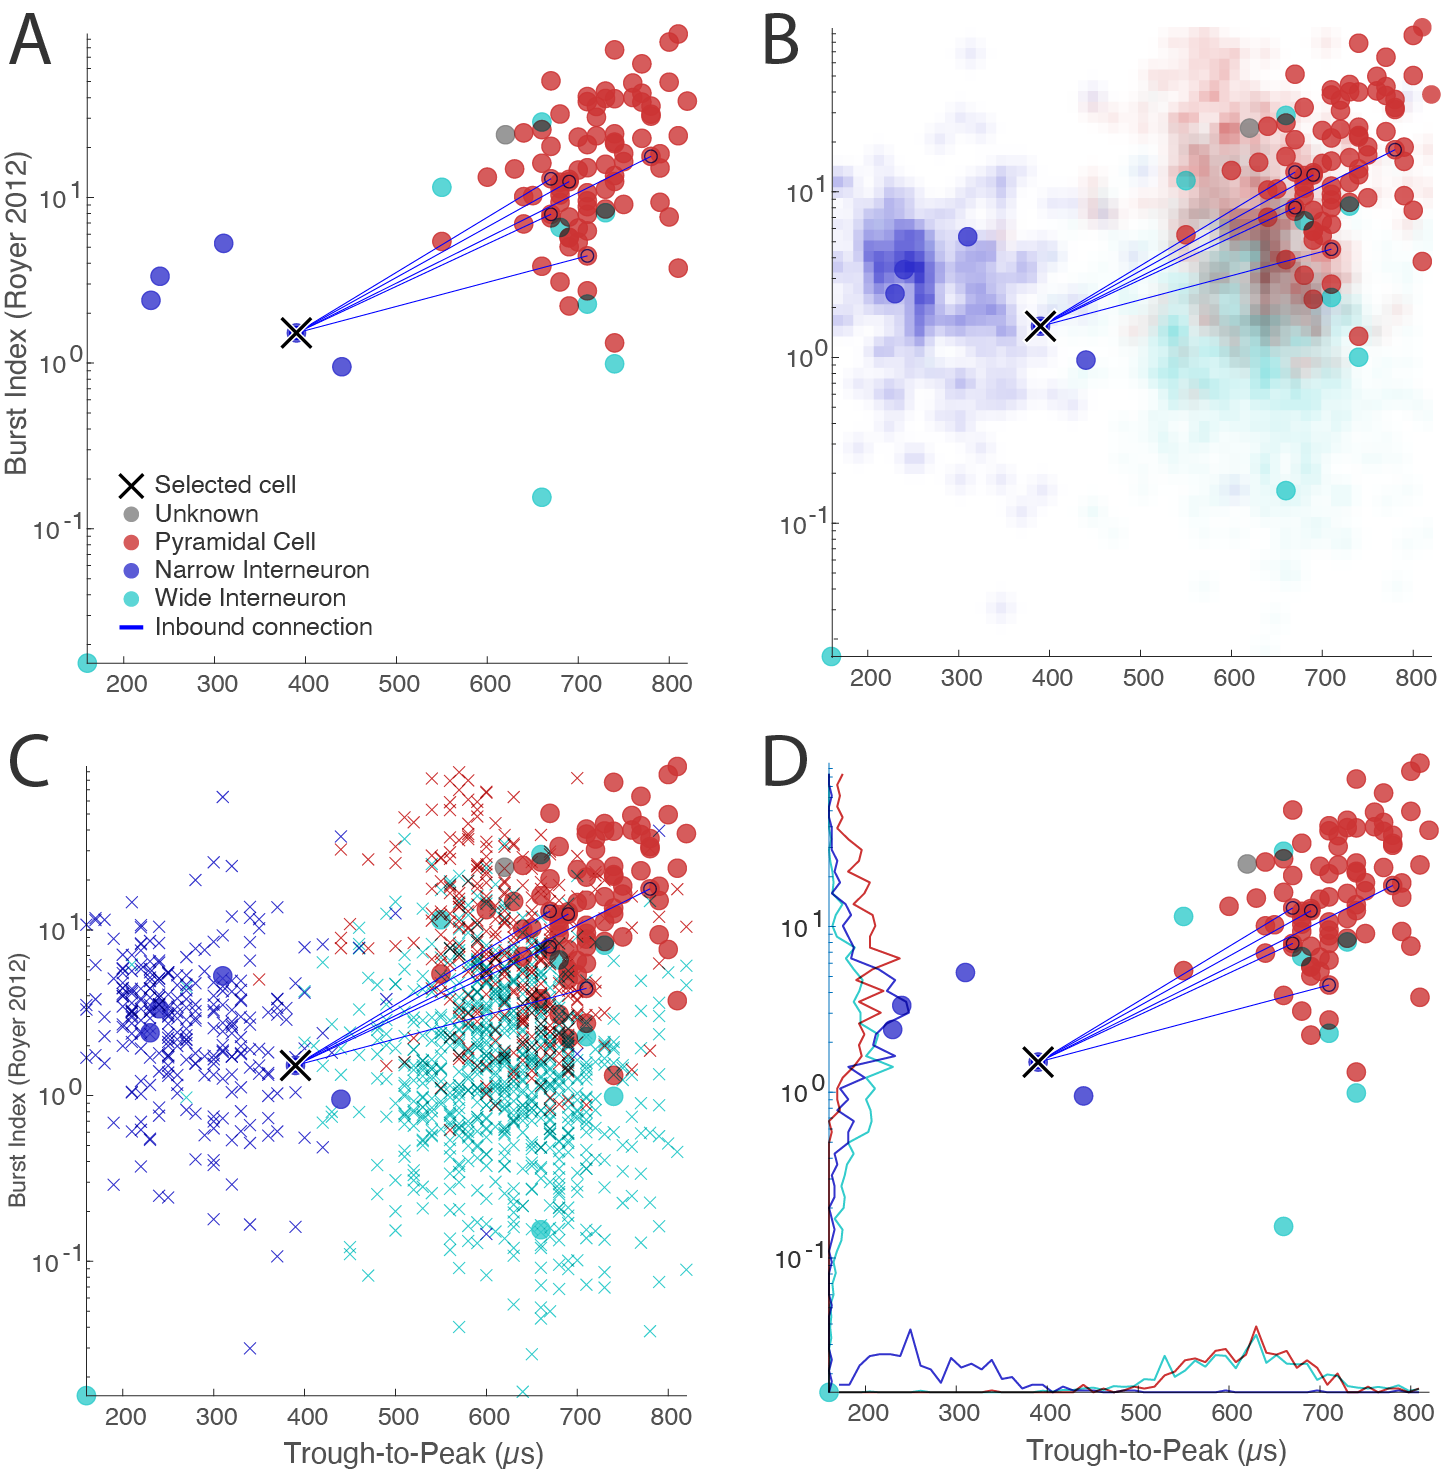
- Image data: 2d colored density map (panel B in figure below. Panel A shows the data regular data representation without reference data).
- Scatter data: scatter points
x(panel C in figure below). - Histogram data: histogram curves along x and y axes (panel D in figure below).
- You can define the number of bins, and which of the reference cell types to display. You can select which of the reference cell types to display in the Display Settings tab group
Reference
Once a selection has been made, you can skip step 2 and 3. The reference data is not displayed in the t-SNE plot. The video below shows the steps in CellExplorer:
Below figure shows the various ways to plot reference data in CellExplorer: