Monosynaptic connections tutorial
This tutorial will guide you through the manual curation process of the monosynaptic connections. Monosynaptic connections, both excitatory and inhibitory connections, are determined in the pipeline. You can visualize the connections and perform manual curation in a graphical interface.
Implementation
The Processing module will automatically perform these action, but if you want to detect monosynaptic connections in a dataset independently use below script
mono_res = ce_MonoSynConvClick(spikes,'includeInhibitoryConnections',true/false); % detects the monosynaptic connections
gui_MonoSyn(mono_res) % Shows the GUI for manual curation
You can select to determine inhibitory connections as well. This is not done by default, as the algorithm finds many false positive connections. There are further optional inputs. See the header of ce_MonoSynConvClick for further info.
Manual curation
There are a few principles you have to follow when doing the manual curation:
Acceptance criteria
- The synaptic peak should occur with about 2ms delay if the cells are located close together.
- The monosynaptic peak should be shaped as a double exponential function with a fast rise and a slower decay. In the hippocampus the excitatory connections last for about 2 ms in the CCG. Inhibitory connections typically have a slower decay.
Rejection criteria
- CCG shows a maintained refractory period. The units should have been merged in the spike sorting process.
- If the CCG peak coincide with ACG peak (typically slower than 2ms), it is likely that the units should have been merged in the spike sorting process, or that the considered cell pair is contaminated with a third unit. This often occurs together with a maintained refractory period, but this will not always be the case for contaminated units and is often due to spike bursts.
- A broad centrally aligned CCG peak indicates common drive and the connection should potentially be rejected. Common drive can also be temporally shifted if the cells are located far from each other. This is often seen when comparing two cells located at different shanks (hundreds of µm apart). Common drive can easily occur together with monosynaptic connections and the two can be difficult to differentiate.
Using the graphical interface for curating monosynaptic connections
- Launch the monoSyn GUI providing the path to your data:
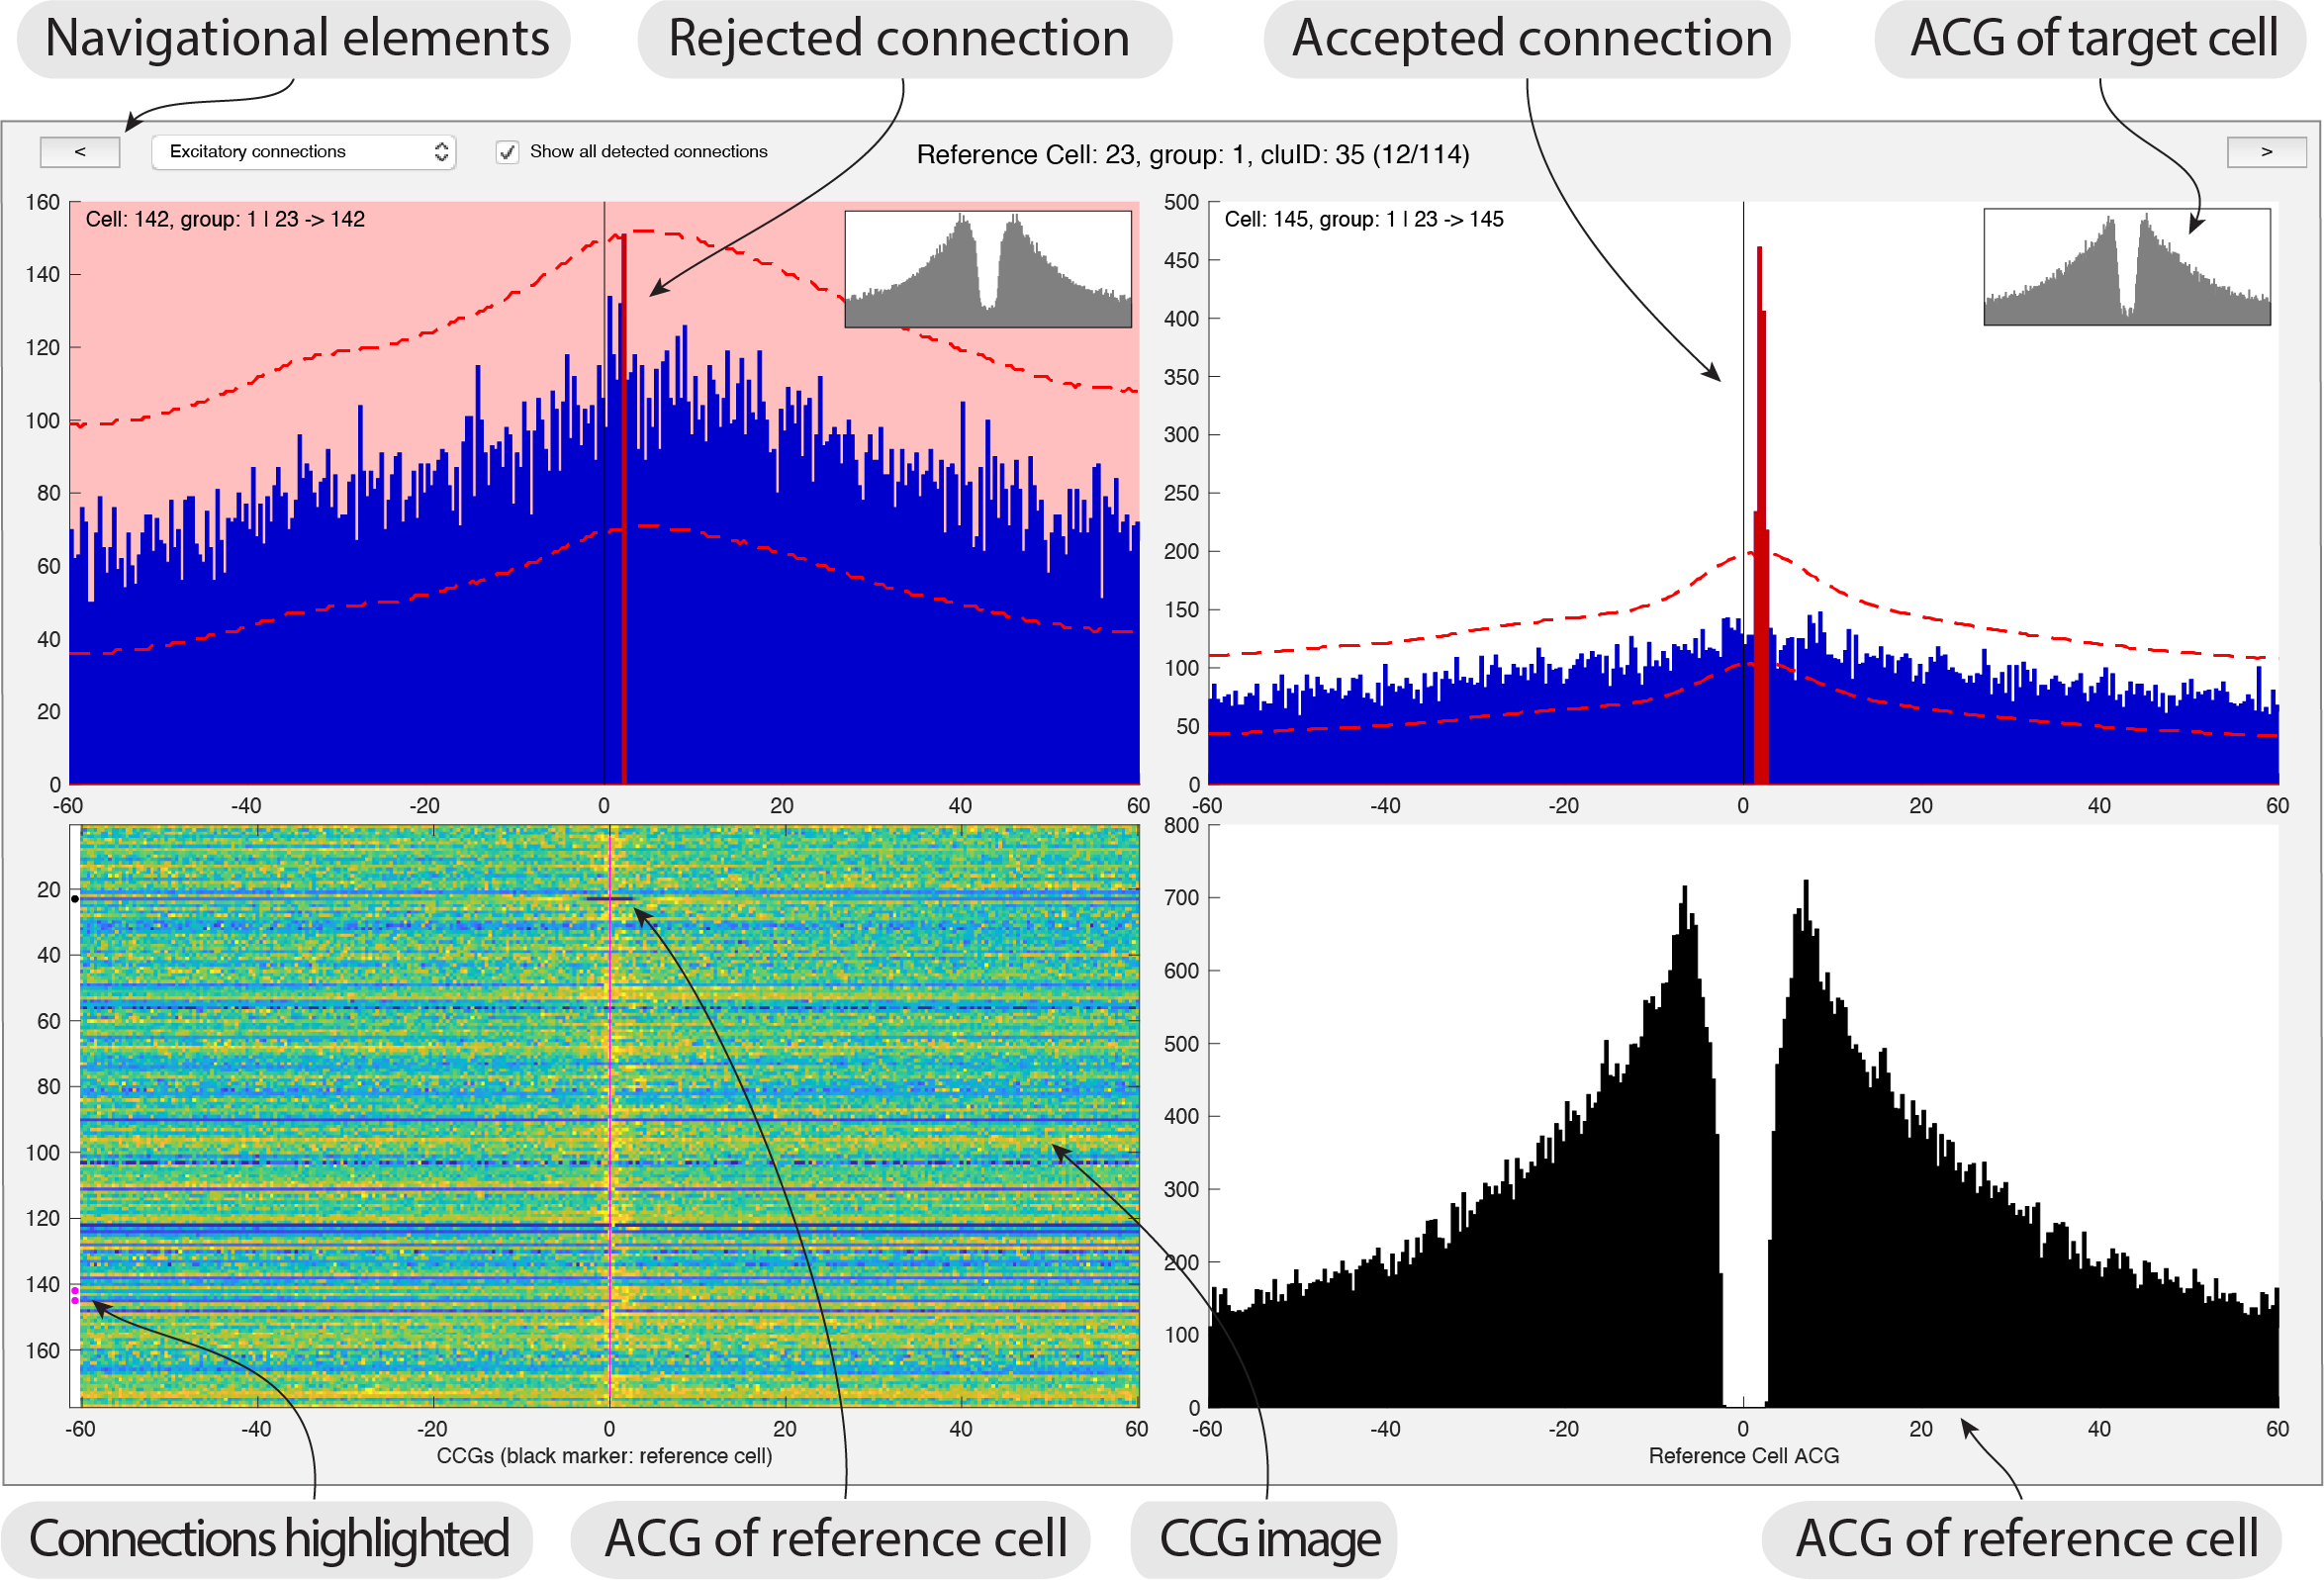
gui_MonoSyn('path_to_data') - The interface shows you a reference cell together with related connections. CCGs (shown in blue) between all potential connections related to a reference cell (ACG shown in black). The ACG for each potential cell is shown in a small plot inset with each CCG. A image with all CCGs between the reference cell and the rest of the population is also displayed, including the ACG of the reference cell (highlighted with a black dot). Significant connections are also highlighted in the image with white dots.
- You can navigate the reference cells using the top two buttons shown in the GUI, or use the left and right arrows. Each connection is displayed twice: where the direction of the connection is shown in context with other connections for that reference cell. This provide insight into the CCG patterns, which is relevant for judging connections of hub-like cells and to detect patterns across CCGs. Press
Hin the GUI to learn all the shortcuts. - Following the principles stated above, you can now adjust the connections.
- The primary action you can perform in the GUI is rejecting connections. The pipeline determines the connections that fulfills the statistical test, and the manual process consists of confirming and rejecting these connections.
- Excitatory connections are shown at first, but you can select to show inhibitory connections from the top drop-down menu.
- To reject a connection you simply click the CCG and it will turn red as shown in the screenshot above. You can also use the keypad to select/reject the CCGs.
- You can switch between showing all significant connections, and the subset accepted during the manual curation process.
- when you have completed the curation process, simply close the figure and you will be prompted to save the curation.
Launch the Monosyn GUI directly from CellExplorer
- Launch CellExplorer
cell_metrics = CellExplorer('metrics',cell_metrics); - From the top menu select
MonoSyn->Adjust monosynaptic connections. The monoSyn data will now be loaded and the MonoSyn interface will be displayed. - Adjust connections using the mouse or the numeric keypad.
- Once done, simply close the MonoSyn figure.
- You will be prompted to save the manual curation. If you confirm, it will save the
sessionName.mono_res.cellinfo.matto the data folder and update the connections in thecell_metricsfile as well.