Cell metrics
CellExplorer used a single Matlab struct for handling all cell metrics called cell_metrics. The cell_metrics struct consists of three types of fields for handling different types of data: double, char cells and structs. Fields must be defined for all cells in the session (1xnCells). Single numeric values are saved to numeric fields with double precision, and character/string fields are saved in char cell arrays. Time series data like waveforms and session parameters are stored in standard struct fields.
Table of contents
- General metrics
- Spike events based metrics
- ACG & CCG based metrics
- Waveform based metrics
- Cell-type classification
- Monosynaptic connections
- Sorting quality metrics
- Sharp wave ripple metrics
- Theta oscillation metrics
- Firing rate maps
- Spatial metrics
- Firing rate stability metrics
- Event metrics
- Manipulation metrics
- Response curve metrics
- Group data
General metrics
general: structbasename: name of the sessionbasepath: full path to the sessionanimal: a struct containing metadata from an animal subject level, e.g.:sex(Male, Female, Unknown),species(Rat, Mouse,…),strain(Long Evans, C57B1/6,…).session: a struct containing metadata from an animal subject level, e.g.:investigator,sessionType,SpikeSortingMethod.cellCount: number of cells in the session.- The general field also contains timestamps for time-series metrics, states data, bins for average plots and PSTHs and axis labels.
processinginfoContains processing info such as: thedateof the processing , theversionof the script, thefunctionname, and theusernameandhostnamefrom the computer that performed the processing.paramsA struct containing the input parameters used byProcessCellMetrics.
electrodeGroups: electrode group: Shank number / spike group.
brainRegion: Brain region acronyms from Allan institute Brain atlas.sessionName: Name of session (same as thebasename).animal: Name of animal subject.
Spike events based metrics
spikes: struct containing spike timestimes: spike times in seconds for each cell (stored as a cell array following the format of the structspike.times).
spikeCount: Spike count of each cell from the entire session (numeric).firingRate: Firing rate in Hz: Spike count normalized by the interval between the first and the last spike.cv2: Coefficient of variation (CV_2).burstIndex_Mizuseki2012Burst index: Fraction of spikes with a neighboring ISI < 6 ms as defined by Mizuseki et al. Hippocampus 2012.
ACG & CCG based metrics
acg: autocorrelograms. Three types:wide[-1000 ms : 1 ms: 1000 ms]narrow[-50 ms : 0.5 ms : 50 ms]log10[log-intervals spanning 1 ms : 10 s].
isi: interspike intervalslog10[log-intervals spanning 1 ms : 10 s].
- Autocorrelograms are fitted with a triple-exponential equation:
ACG_fit = 'max(c*(exp(-(x-f)/a)-d*exp(-(x-f)/b))+h*exp(-(x-f)/g)+e,0)'
a = tau_decay, b = tau_rise, c = decay_amplitude, d = rise_amplitude, e = asymptote, f = refrac, g = tau_burst, h = burst_amplitude
See the dedicated page about the fitting procedure.
acg_tau_riseACG tau rise (ms)acg_tau_decayACG tau decay (ms)acg_tau_burstACG tau bursts (ms)acg_refracACG refractory period (ms)acg_fit_rsquareACG fit R-squarethetaModulationIndexis defined by the difference between the theta modulation trough (mean of autocorrelogram bins 50-70 ms) and the theta modulation peak (mean of autocorrelogram bins 100-140ms) over their sum.synapticEffect: Synaptic effectburstIndex_Royer2012Burst index (Royer 2012)burstIndex_DoubletsBurst index doublets.synapticConnectionsIn: Synaptic ingoing connections count.synapticConnectionsOut: Synaptic outgoing connections count.
Waveform based metrics
waveforms: spike waveform struct with below fields:filt: Average filtered spike waveform from channel with max amplitude. High-pass filtered above 500Hz to standardize waveforms.raw: Average raw spike waveform from channel with max amplitude.time: Time vector for average raw spike waveform from channel with max amplitude.filt_std: Std of the the filtered spike waveform from channel with max amplitude.raw_std: Std of the the raw spike waveform from channel with max amplitude.filt_all: Filtered spike waveform from all/subset of channel.raw_all: Filtered spike waveform from all/subset of channel.channels_all: List of channels used infilt_allandraw_all.Default: 1:nChannels.
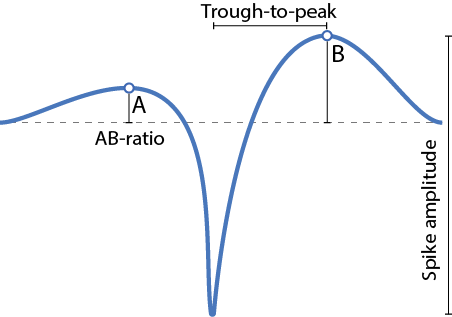
maxWaveformCh: Max channel zero-indexed: The channel with the largest amplitude.maxWaveformCh1: Max channel one-indexed: The channel with the largest amplitude.troughToPeak: Trough-to-peak latency is defined from the trough to the following peak of the waveform.ab_ratio: Waveform asymmetry; the ratio between the two positive peaks(peakB-peakA)/(peakA+peakB).peakVoltage: Peak voltage (µV) Defined from the channel with the maximum high-pass filtered waveform.max(waveform)-min(waveform).
Channel maps
Two channel maps are currently supported by CellExplorer, that are determined from the amplitude of the average waveform across channels.
- Trilaterated channel coordinates.
cell_metrics.trilat_x: x coordinate in µm.cell_metrics.trilat_y: y coordinate in µm.
- Common coordinate framework (CCF; by the Allen Institute). Also determined by trilateration.
cell_metrics.ccf_x: x coordinate in µm.cell_metrics.ccf_y: y coordinate in µm.cell_metrics.ccf_z: z coordinate in µm.
Please see the channel maps tutorial for how to generate the channel maps.
Cell-type classification
putativeCellType: Putative cell types. See the dedicated page about cell-type classification.
Monosynaptic connections
putativeConnections: putative connections determined from cross correlograms. Contains two fields:excitatoryandinhibitory, each contains connections pairs. Transmission probabilities are also stored inexcitatoryTransProbandinhibitoryTransProb.
Sorting quality metrics
Isolation distance and L-ratio as defined by Schmitzer-Torbert et al. Neuroscience. 2005.
isolationDistance: Isolation distance.lRatio: L-ratio.refractoryPeriodViolation: Refractory period violation (‰): Fraction of ISIs less than 2 ms.
Sharp wave ripple metrics
deepSuperficial: Deep-Superficial region assignment [Unknown, Cortical, Superficial, Deep].deepSuperficialDistance: Deep Superficial depth relative to the reversal of the sharp wave. (in um).
Theta oscillation metrics
thetaPhasePeak: Theta phase peakthetaPhaseTrough: Theta phase troughthetaEntrainment: Theta entrainmentthetaModulationIndex: Theta modulation index. Originally defined in Cacucci et al., JNeuro 2004. Computed as the difference between the theta modulation trough (defined as mean of autocorrelogram bins, 50-70 msec) and the theta modulation peak (mean of autocorrelogram bins, 100-140 msec) over their sum, scaled from -1 to 1.
Firing rate maps
firingRateMaps: (spatial) firing rate maps.
Spatial metrics
The spatial metrics are all based on average firing rate map.
spatialCoverageIndex: Spatial coverage index. Defined from the inverse cumulative distribution, where bins are sorted by decreasing rate. The 75 percentile point defines the spatial coverage by the fraction of bins below and above the point (defined by Royer et al., NN 2012)spatialGiniCoeff: Spatial Gini coefficient. Defined as the Gini coefficient of the firing rate map.spatialCoherence: Spatial Coherence. Defined by the degree of correlation between the firing rate map and a hollow convolution with the same map (reference?)spatialPeakRate: Spatial peak firing rate (Hz). Defined as the peak rate from the firing rate map.placeFieldsCount: Number of place fields. Defined as the number of intervals along the firing rate map that fulfills a number of spatial criteria: minimum rate of 2Hz and above 10% of the maximum firing rate bin and minimum of 4 connecting bins. The cell further has to have a spatial coherence greater than 0.6 (Mizuseki et al ?).placeCell: Place cell (binary, determined from the Mizuseki spatial metrics).
Firing rate stability metrics
firingRateGiniCoeff: The Gini coefficient of the firing rate across time.firingRateStd: Standard deviation of the “firing rate across time” divided by the mean.firingRateInstability: Mean of the absolute differential “firing rate across time” divided by the mean:abs(diff(firingRateAcrossTime)).
Event metrics
events: event time series.eventName_modulationIndex: strength of modulation. The difference between the averages of the stimulation interval and the pre-stimulation interval (the baseline) divided by their sum. Scaled from -1 to 1.eventName_modulationRatio: strength of modulation. The ratio between the averages of the stimulation interval and the pre-stimulation interval (the baseline).eventName_modulationPeakResponseTime: temporal response. The delay between the ripple peak and the peak response of the ripple triggered average response.eventName_modulationSignificanceLevel: KS-test (kstest2) between the stimulation values and the pre-stimulation values, pre-smoothing.
Manipulation metrics
manipulations: manipulations time series.manipulationName_modulationIndex: strength of modulation. The difference between the averages of the stimulation interval and the pre-stimulation interval (the baseline) divided by their sum. Scaled from -1 to 1.manipulationName_modulationRatio: strength of modulation. The ratio between the averages of the stimulation interval and the pre-stimulation interval (the baseline).manipulationName_modulationPeakResponseTime: temporal response. The delay between the ripple peak and the peak response of the ripple triggered average response.manipulationName_modulationSignificanceLevel: KS-test (kstest2) between the stimulation values and the pre-stimulation values, pre-smoothing.
Response curve metrics
responseCurves: response curves.
Group data
groups: Cell groups. Each cell can be assigned to one or more groups.tags: Each cell can be assigned to one or more tags.groundTruthClassification: Opto-tagged/ground truth cell groups. Each cell can be assigned to one or more groups.