UI elements
Table of contents
- Elements
- Navigation and cell selection
- Cell Assignment
- Display Settings
- Plot selection
- Filter by free text
- Metrics table
- Message log
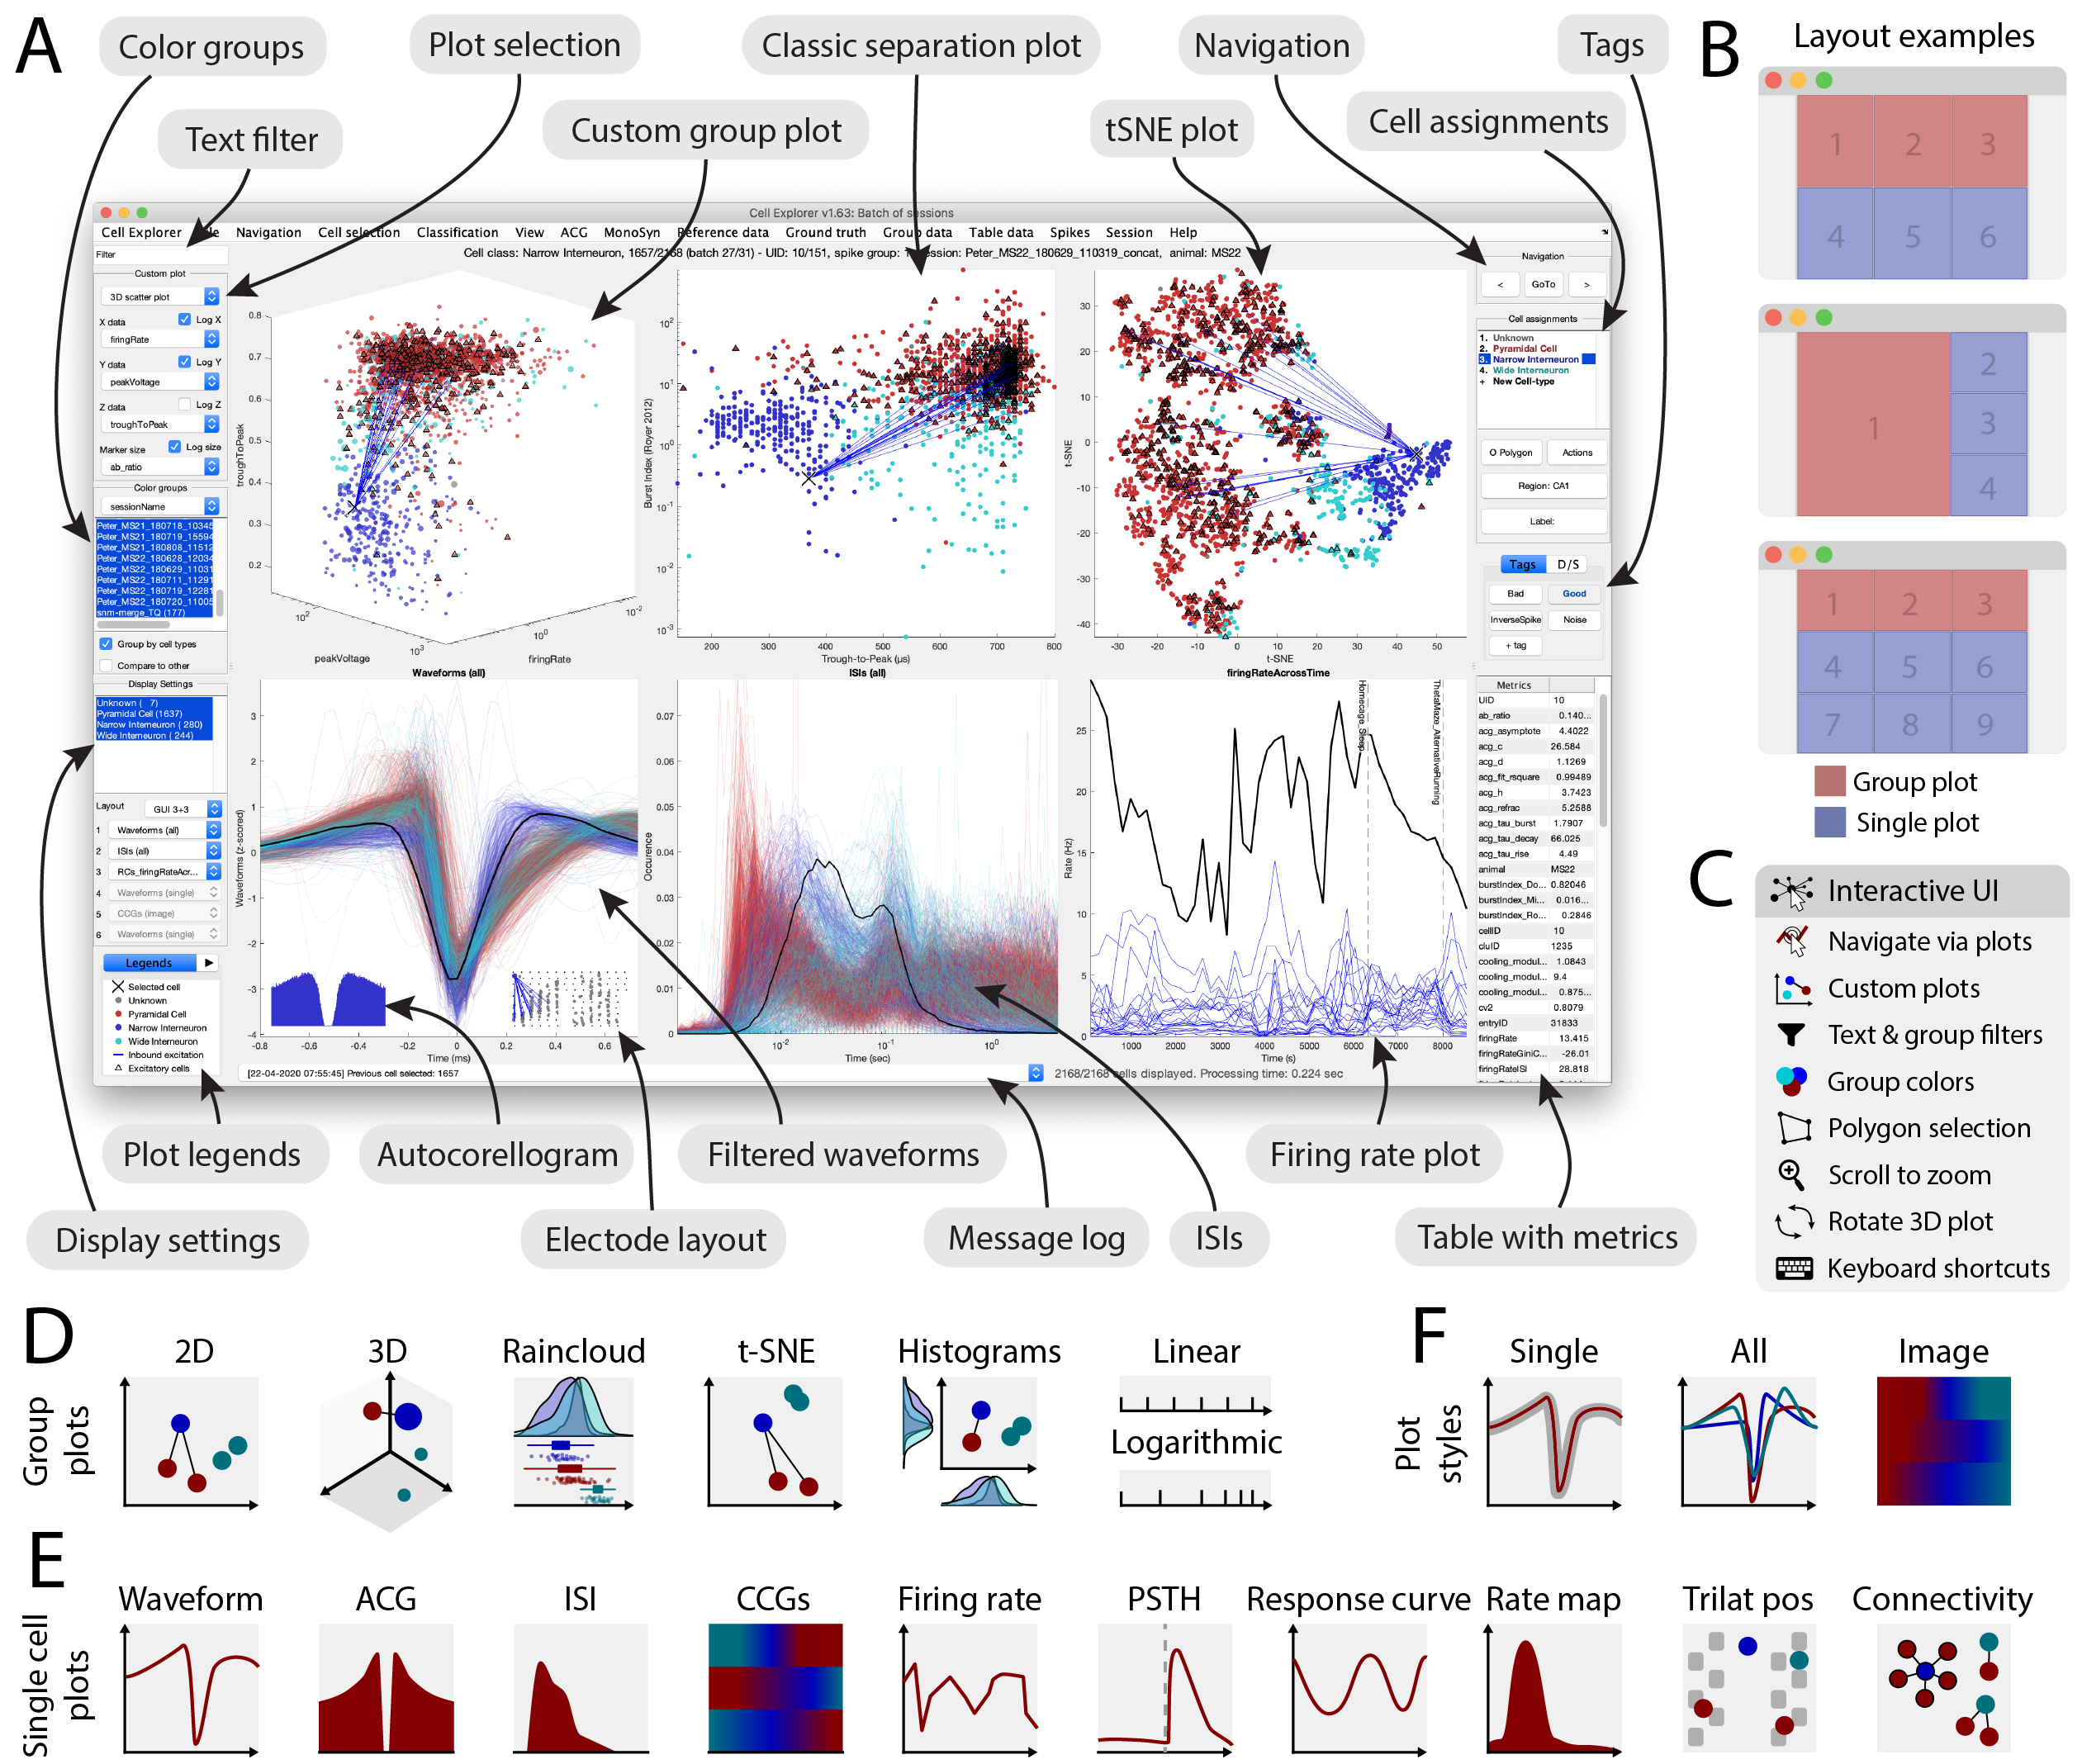
Elements
The interface consists of 4-9 main plots. The top row is dedicated to population level representations of cell groups and the remaining plots are selectable and customizable plots for individual cells (including variations of waveforms, ACGs, ISIs, CCGs, PSTHs, response curves and firing rate maps). The interface surronding the plots, consists of 7 panels placed on either side of the graphs: On the right side there is a navigation panel, a cell assignment panel, a display settings panel, and on the left side a plot selection panel, a color group panel and a table with cell metrics. The panels are described in details below. Further there is a text field for custom text filter in the upper left corner, a message log and figure legends at the bottom. There are keyboard shortcuts that allow you to quickly navigate your data. Press H in CellExplorer to see the keyboard shortcuts.
Navigation and cell selection
The Navigation panel allows you can navigate and select which cell to display.
Left arrow: navigate to the next cell.Right arrow: navigate to the previous cell.GoTo: Opens a dialog box that allows you go to a specific cell, or session when visualizing a batch of sessions. Mouse actions in plotsLeft mouse click: Pan the plot around the location of the mouse cursor. In the 3D group plot aLeft mouse clickallows you to rotate the 3D plot.Mouse scroll wheel: zoom in or out at the location of the mouse cursor.Middle mouse click: go to nearest cell.Right mouse click: select nearest cell. Cell point/trace is highlighted and Cell ID is displayed for selected cell(s).
Cell Assignment
The Cell Assignment panel allows you to perform relevant types of cell-assignments such as cell-type, Deep/Superficial, assign brain region or label. The cell assignments are saved to the cell_metrics structure.
Cell-type list: You can assign/alter cell-type of the current cell by clicking a cell-type on the list.O Polygon: Perform cell classification on a group of cells by drawing a polygon circling the points in either of the scatter plots, waveforms, or ACGs.+ Cell-type: Allows you to add a new cell-type.Region: Brain region assignment of the selected cell according to the Allan Institute Brain Atlas.Label: Assign a label to the selected cell.
Display Settings
The Display Settings panel allows you to customize the plots in CellExplorer. Cell-type list: Defines the displayed cell-types. Layout: Adjust the layout and number of cell specific plots to display: 1+3 -> 3+6 1.-6. view: A drop-down menu for each of the cell plots containing available options like the Firing rate map, tSNE plots, Sharp wave-ripple, Autocorrelograms, waveforms, all plots associated with the selected cell.
Plot selection
The plot selection panel allows you to customize the first scatter plot, select what data to display, change the axis type, adjust the plotting style and the color groups.
Plot style: Allows you to alter the custom plot: 1. 2D and 3D scatter plot. 2. 2D scatter plot with histograms. 3. Raincloud plot.
Select X,Select Y and Select Z data: Allows you to select what metrics that are displayed on the X,Y and Z axes respectively.
Log X, Log Y and Log Z: Define if a linear or log scale will be used for the X, Y and Z axes respectively.
Show Z: Whether to display the third axis.
Select color group: A drop-down menu with cell-array metrics, which allows you to group the cells according to these metrics including, Deep-Superficial, Brain regions and Labels. When selecting another option than cell-types, two new menu items appears below the drop-down that allows you to select a subset of groups in the scatter plots, and further combine this selection with a potential subset selection in Cell types.
Group by cell-type: Allows you to define a subset of cells that fulfills both the selection in cell-types and the selection in color group, but group the data according to cell types.
Filter by free text
A filter field is located in the top left corner of the interface. You can filter by text strings or by specific criteria from numeric fields. You can further combine criteria by and/or logic e.g.:
Filter by text string “MS” and firing rate > 5 Hz: MS & .firingRate > 5.
Filter by MS or HIP: MS | HIP.
Filter by ab_ratio > 1 and troughToPeak > 0.6 ms: .ab_ratio > 1 & .troughToPeak > 0.6.
Metrics table
The table contains all numeric values for the selected cell and is updated as you navigate the interface. The table can show two types of data: A list of cell metrics and associated values for the selected cell or a list of all cells with selection marker, and two other metrics. Use the menu Table data to customize what is displayed in the table.
Message log
At the bottom of the interface, there is a message log showing details about the actions performed. You can click it to see the full list of commands with timestamps.