Running pipeline
The pipeline consists of three steps:
- Gathering metadata
- Processing cell_metrics
- Running CellExplorer
Table of contents
Flowcharts
The flowcharts below show the processes in details. The boxes are color coded according to external files (grey), data structures (yellow), CellExplorer functions (green), and database (purple).
Preparing experimental metadata
First step is gathering metadata in the session struct. This struct can contain all metadata necessary for calculating the cell metrics. You can use the sessionTemplate to extract and define the parameters and visualize them with the graphical interface gui_session for further manual entry. The templates will scan the basepath for specific files, and import existing metadata to minimize the manual entry. You can customize the template script to fit and extract information relevant to your data. The session struct is defined here. The session struct follows the database structure of the Buzsaki Lab and all metadata can be loaded directly from the database for database sessions. See the example code below on how perform the actions in Matlab. 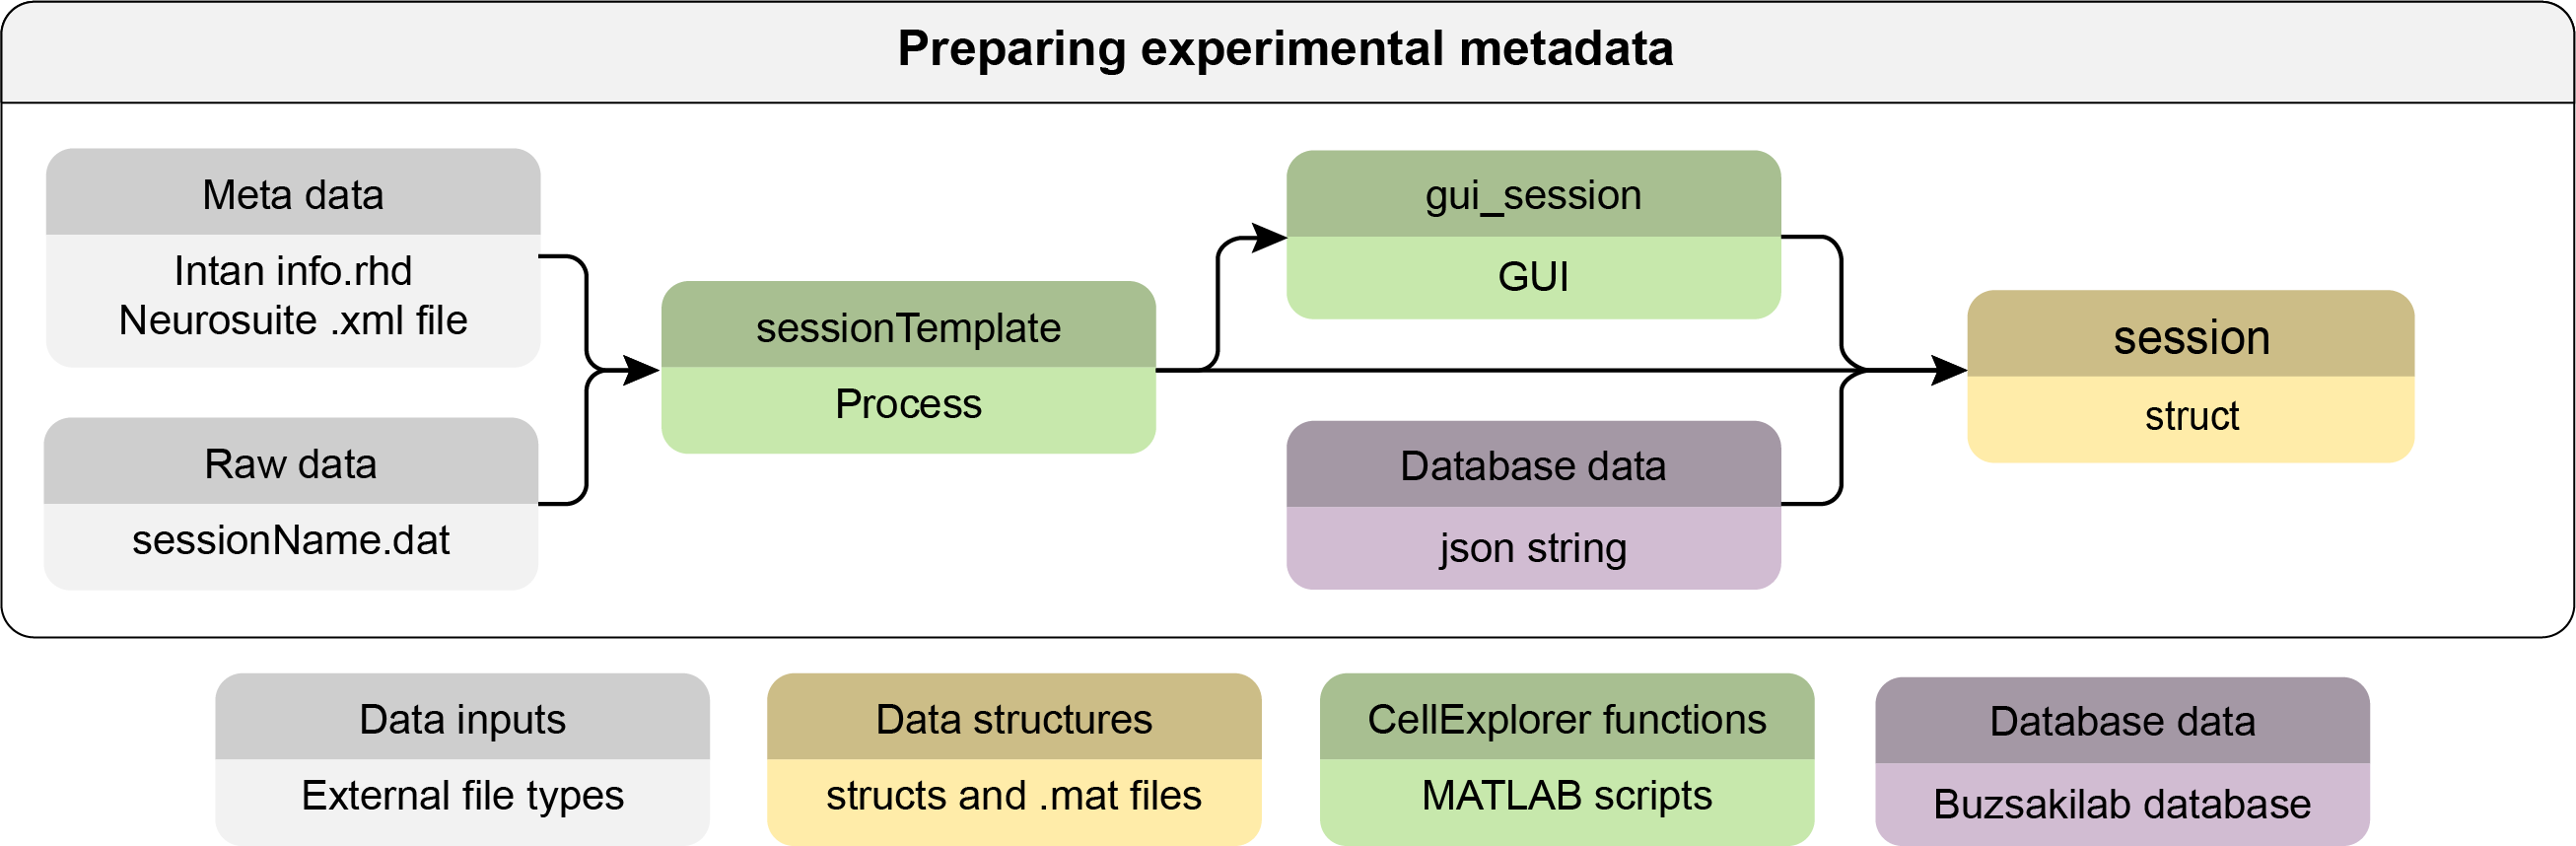
Processing cell_metrics
Following the definition of metadata, the cell metrics calculation process can be performed. A single script processes all default cell_metrics (which can be customized and expanded). The process is fully automatic, except for the detection of monosynaptic connections, in which a graphical interface is shown for manual curation (the manual step can be turned off). See the full list of default cell_metrics here. Below follows two flowcharts: a simple with the minimal inputs and an advanced flowchart. The advanced chart shows all relevant files that are compatible, auto-detected and loaded by the cell_metrics calculation process. 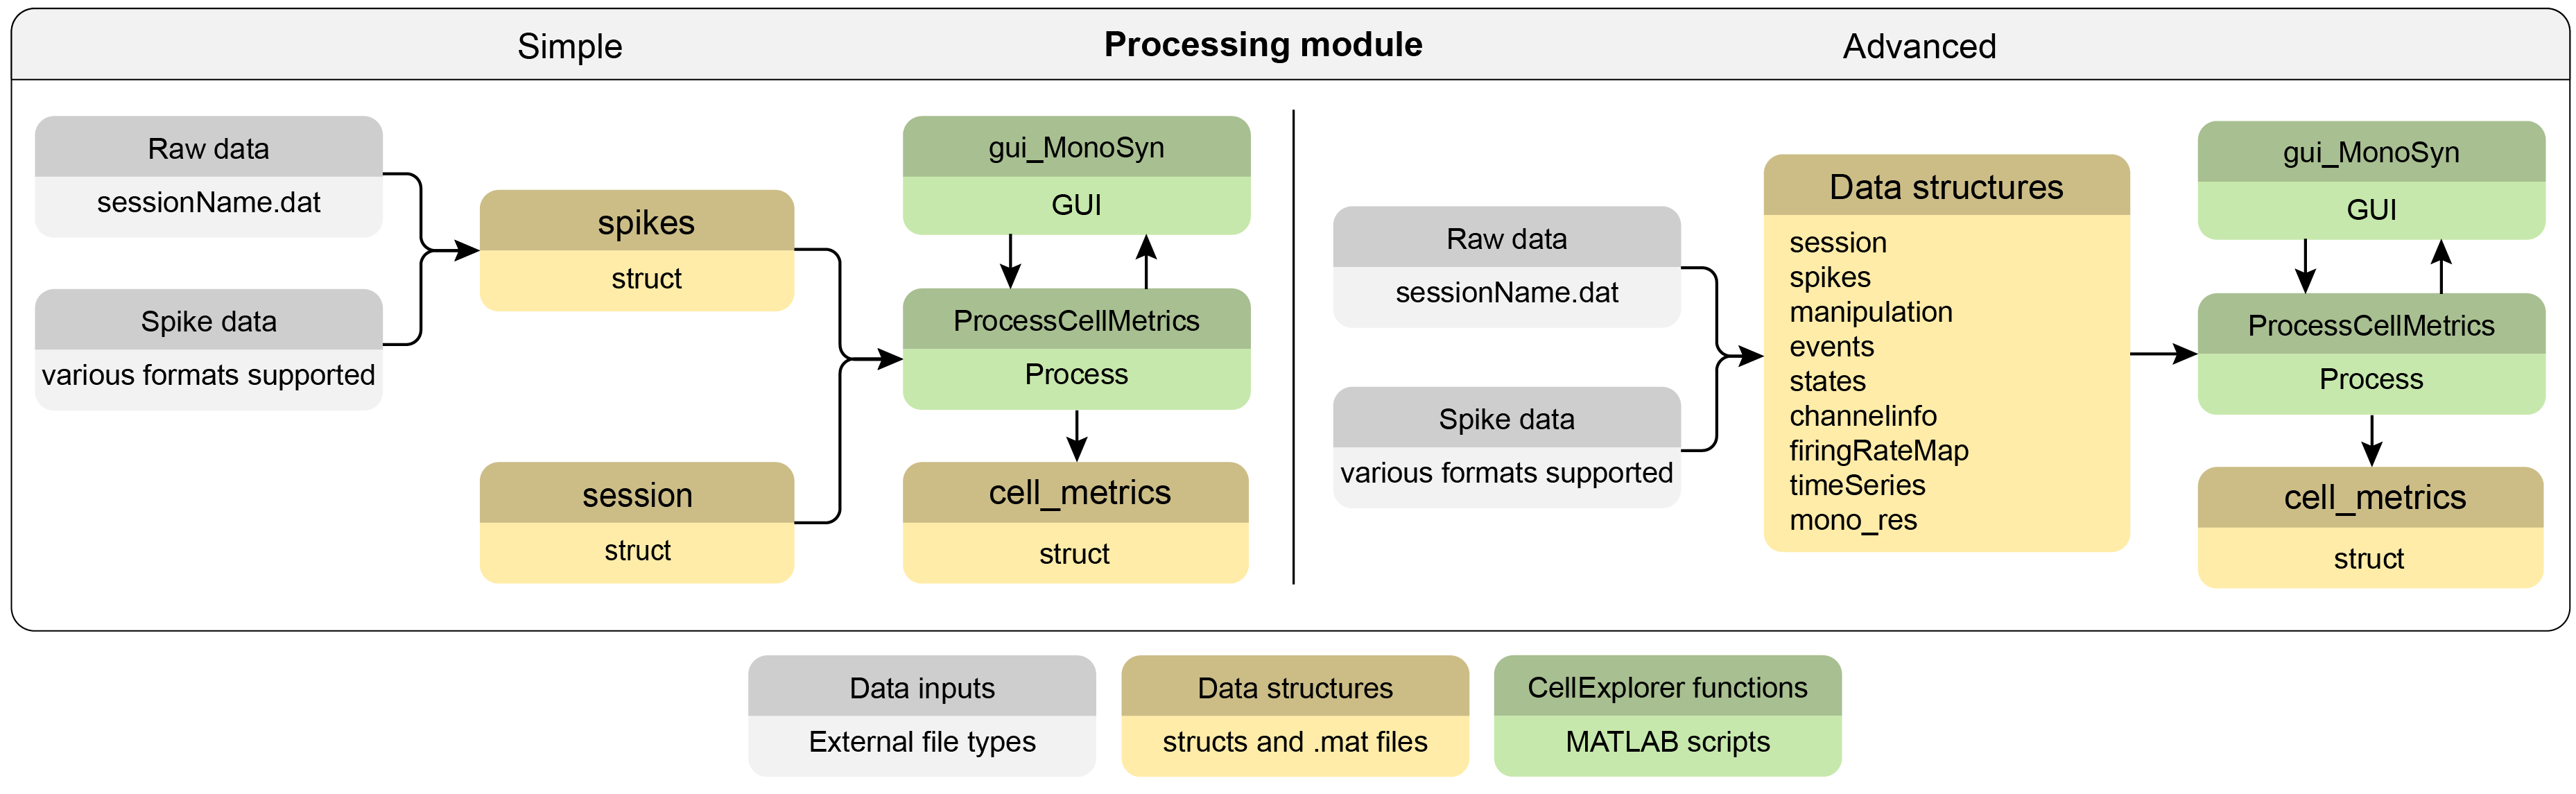
Running CellExplorer
CellExplorer can be used with single recording sessions as well as batches of sessions. Batch loading is performed with the script loadCellMetricsBatch. The advanced flowchart below further details the capabilities of loading various GUIs from CellExplorer (gui_session, gui_MonoSyn and gui_DeelSuperficial) as well as do spike raster plots, that requires access to the local spikes struct and potentially also manipulation and events files when plotting PSTHs. 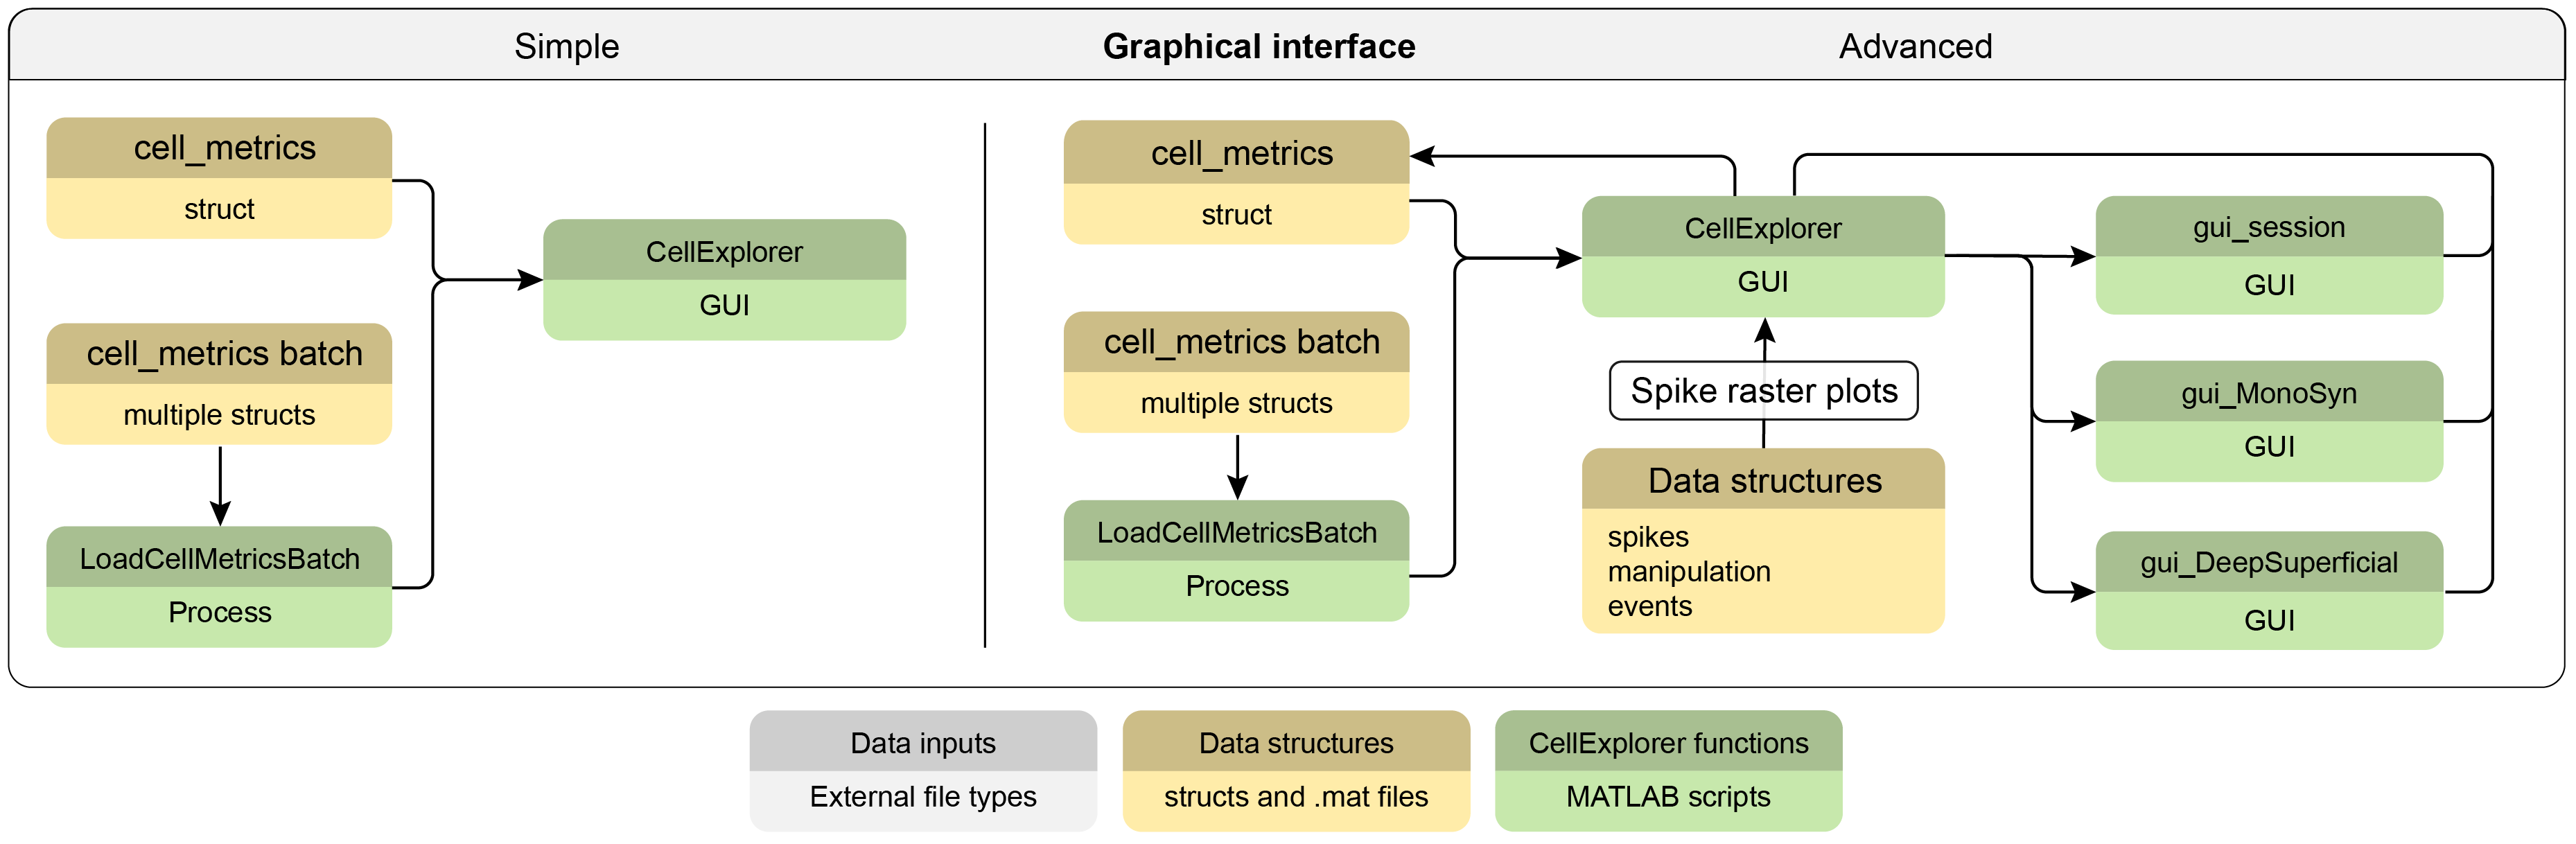
Running pipeline from a data path
The pipeline follows the data standards described here. Saving your data in the specified data formats, integrates your data better with CellExplorer, allowing you to plot spike rasters and event histograms among other things.
To run the pipeline from a session struct, please see this example sessionTemplate.m file for how to format this properly. Please edit the template file to fit it to your data.
session = sessionTemplate;
You can also view the session struct in a GUI:
session = gui_session(session);
To run the processing script from the Matlab Command Window from the session struct type:
cell_metrics = ProcessCellMetrics('session', session);
You can also run it directly from a basepath and generate the session struct directly:
cell_metrics = ProcessCellMetrics;
When calling the processing script with the sessionTemplate, a GUI will be shown allowing you to edit metadata, both input parameters and the session struct.
Once complete, view the result in CellExplorer by typing:
cell_metrics = CellExplorer('metrics',cell_metrics);
Running CellExplorer in batch mode from list of data paths
To open multiple sessions together you can run CellExplorer in batch mode. Below is an example for running CellExplorer on three sessions from the database:
bsasepaths = {'sessionName1','sessionName2','sessionName3'};
cell_metrics = loadCellMetricsBatch('basepaths',bsasepaths);
cell_metrics = CellExplorer('metrics',cell_metrics);
As you perform classifications in CellExplorer, you may save back to the original cell metrics stored with the sessions defined above. You can perform the batch mode from a list of paths as well.
Running pipeline using the Buzsaki lab database (for Buzsaki lab members)
CellExplorer processing module ProcessCellMetrics uses a single Matlab struct for handling metadata. The struct is automatically loaded from the -buzsaki lab database if you are running the pipeline with the database, and is located in the base path once a session has been processed. To run the pipeline on a session named ‘PetersSession’ using the database type:
cell_metrics = ProcessCellMetrics('sessionName','PetersSession');
To view the result in CellExplorer type:
cell_metrics = CellExplorer('metrics',cell_metrics);
Running CellExplorer in batch mode from database
To open multiple sessions together you can run CellExplorer in batch mode. Below is an example for running CellExplorer on three sessions from the database:
sessionNames = {'sessionName1','sessionName2','sessionName3'};
cell_metrics = loadCellMetricsBatch('sessions',sessionNames);
cell_metrics = CellExplorer('metrics',cell_metrics);
As you perform classifications in CellExplorer in batch mode, you can save your progress to the original sessions. You can work in batch mode from a list of paths as well.