NeuroScope2
NeuroScope2 is a data viewer for raw and processed extracellular data acquired using multi-site silicon probes, tetrodes, or single wires. It is written in Matlab, maintaining many of the original functions of NeuroScope, but with many enhancements. It can be used to explore existing data and to stream data being collected and can handle multiple data streams simultaneously - e.g. digital, analog, and aux channels from Intan - together with the raw ephys data. As NeuroScope2 is written in MATLAB, it is hackable, adaptable, and expandable. It is faster than the original NeuroScope, and functions fully within the data types of CellExplorer, using the session struct for metadata.
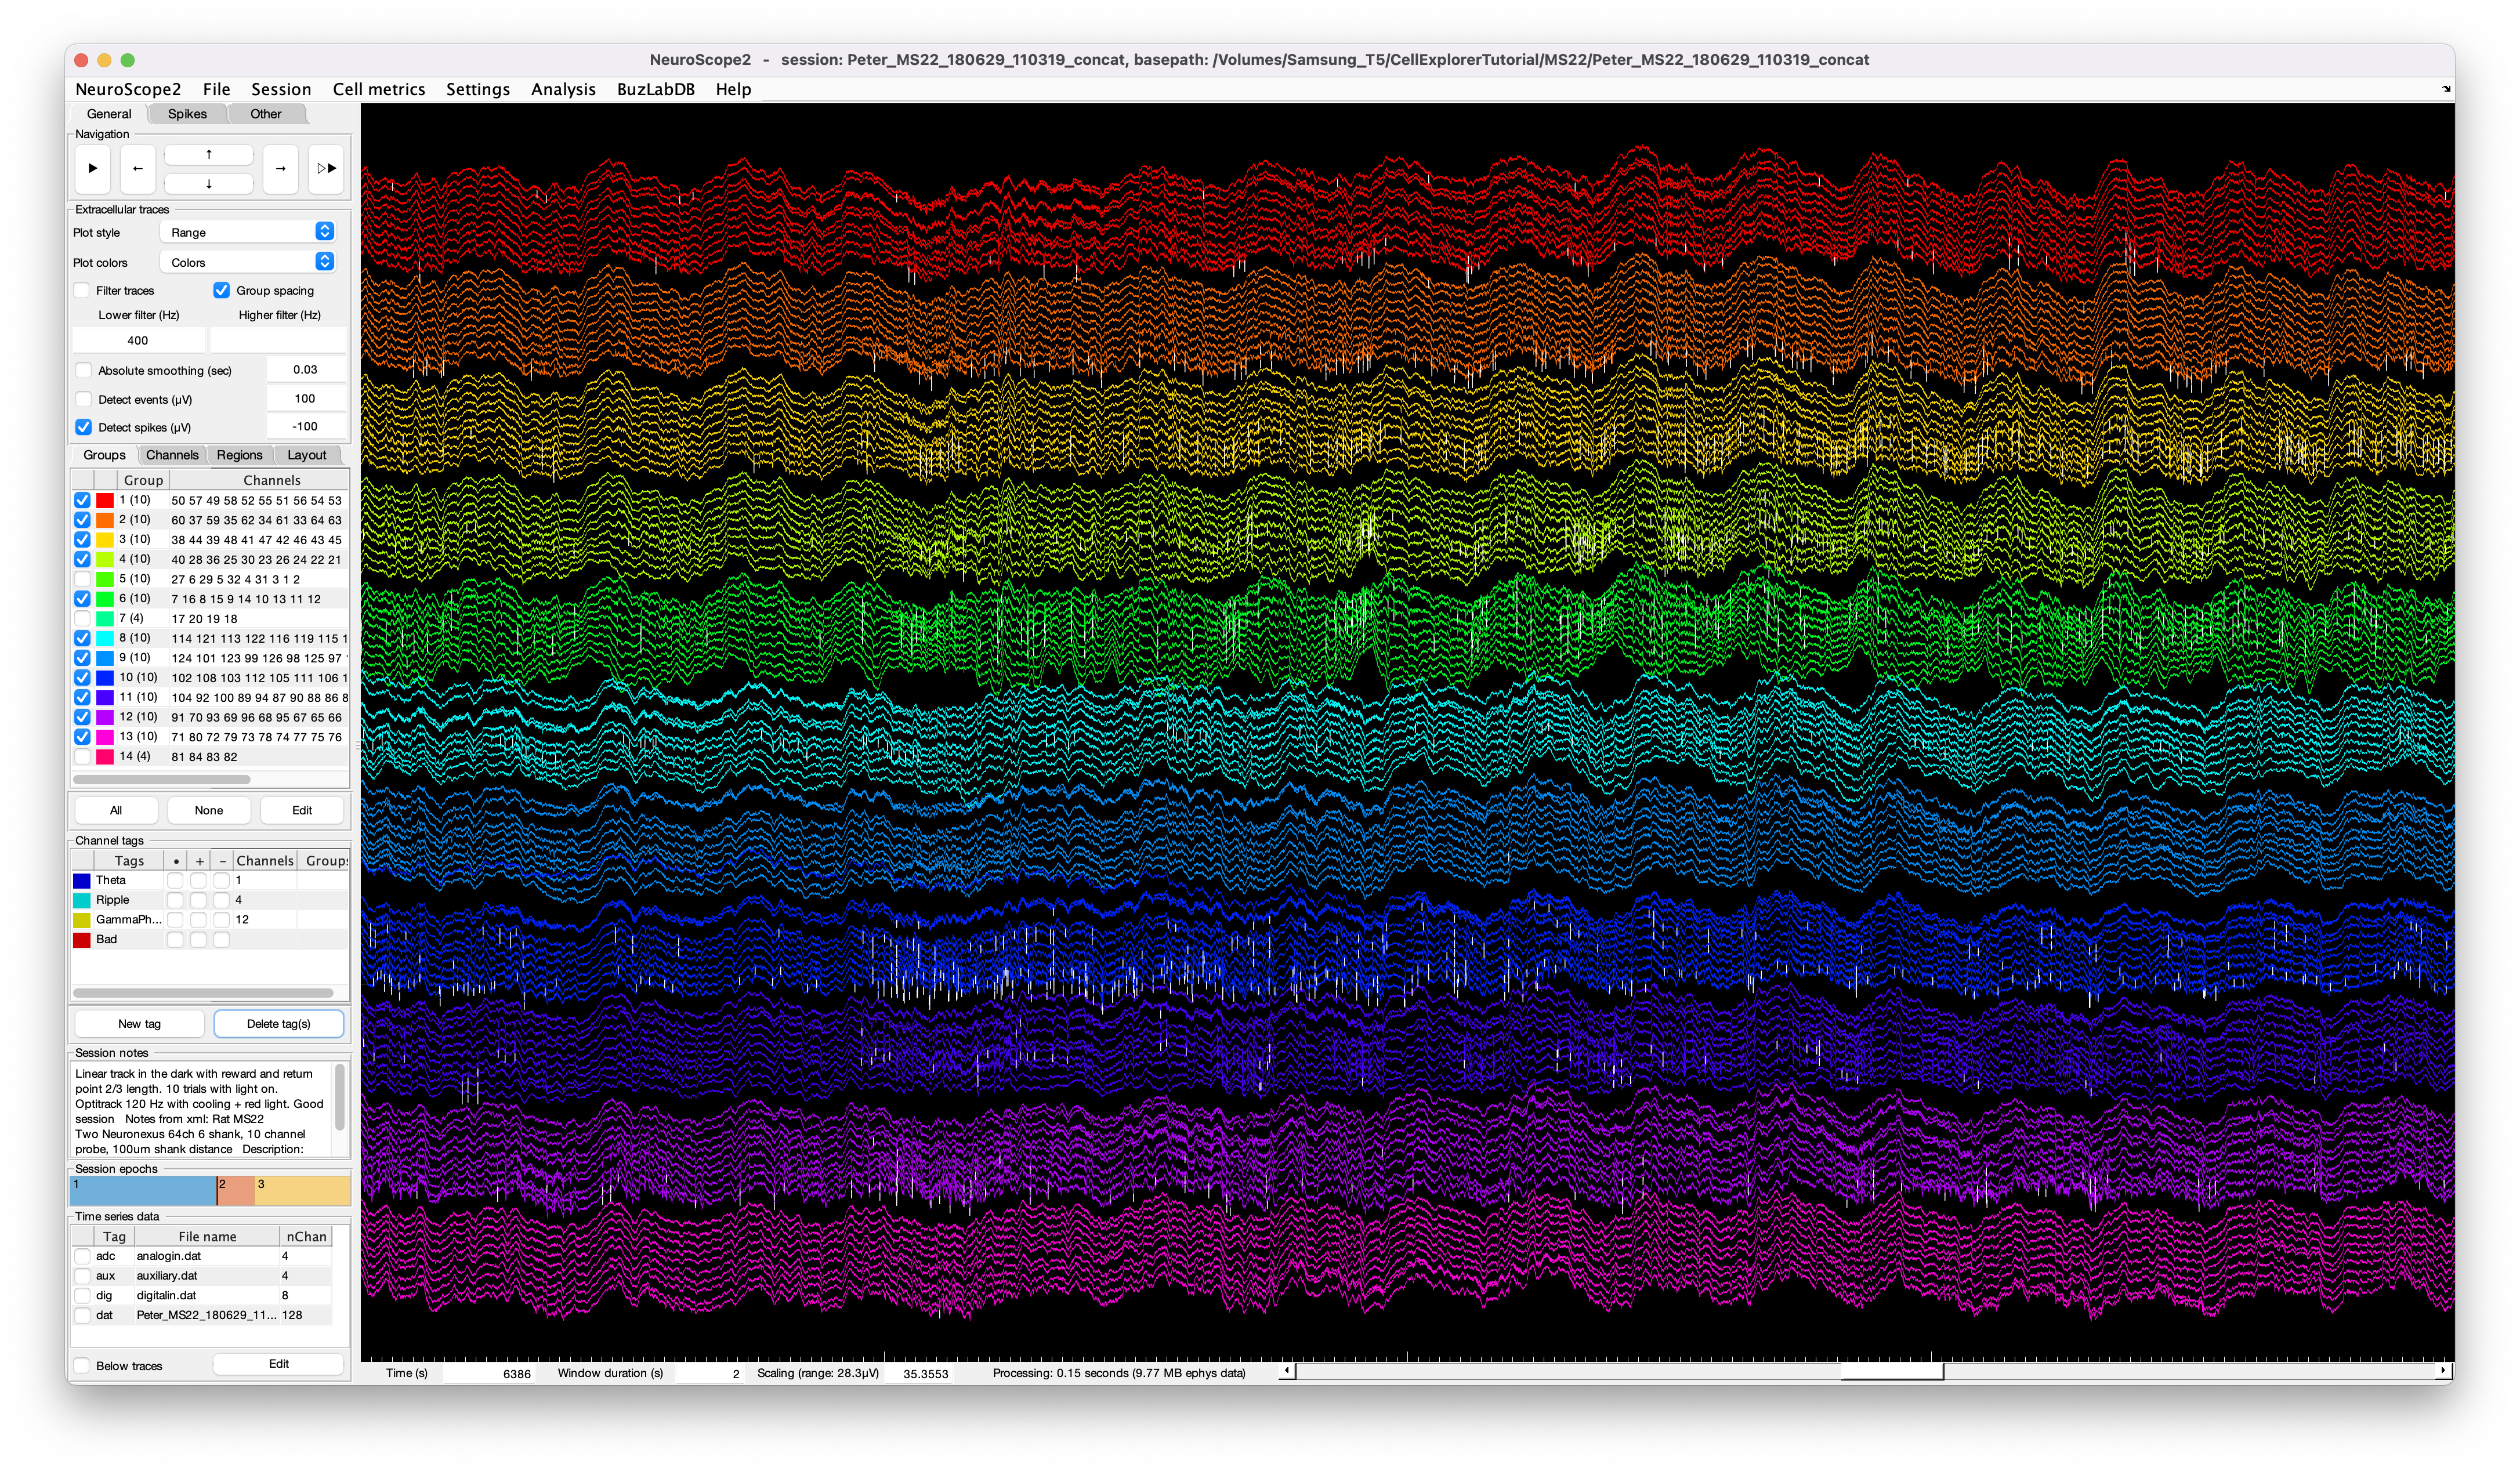
Table of contents
Features
The user-friendly interface has a single side panel for accessing most functions. You can zoom, navigate, measure, highlight, and select traces directly with your mouse cursor, making manual inspection intuitive and efficient. NeuroScope2 can also perform basic data processing (that works on data being collected as well), e.g. band-pass filter traces, perform temporal smoothing, perform spike and events detection directly on the raw or processed traces. Channel tags can be used to highlight and filter (+/-) channels.
You can view CellExplorer, Buzcode, and other .mat structures:
- Session metadata
- spikes: plot spike rasters on the ephys traces or separately below the traces.
- cell metrics: use cell metrics to filter, group, or sort cells (see the example screenshot below).
- events and manipulations: You can inspect the detected events and flag individual events (again see the example below).
- states: show and navigate states.
- behavior and trials: Show 2D behavior (not standardized yet), linearized positions, and trial data.
- timeseries: Show time series data.
- Other spike sorting data formats: KiloSort, Klustakwik, and Spyking Circus.
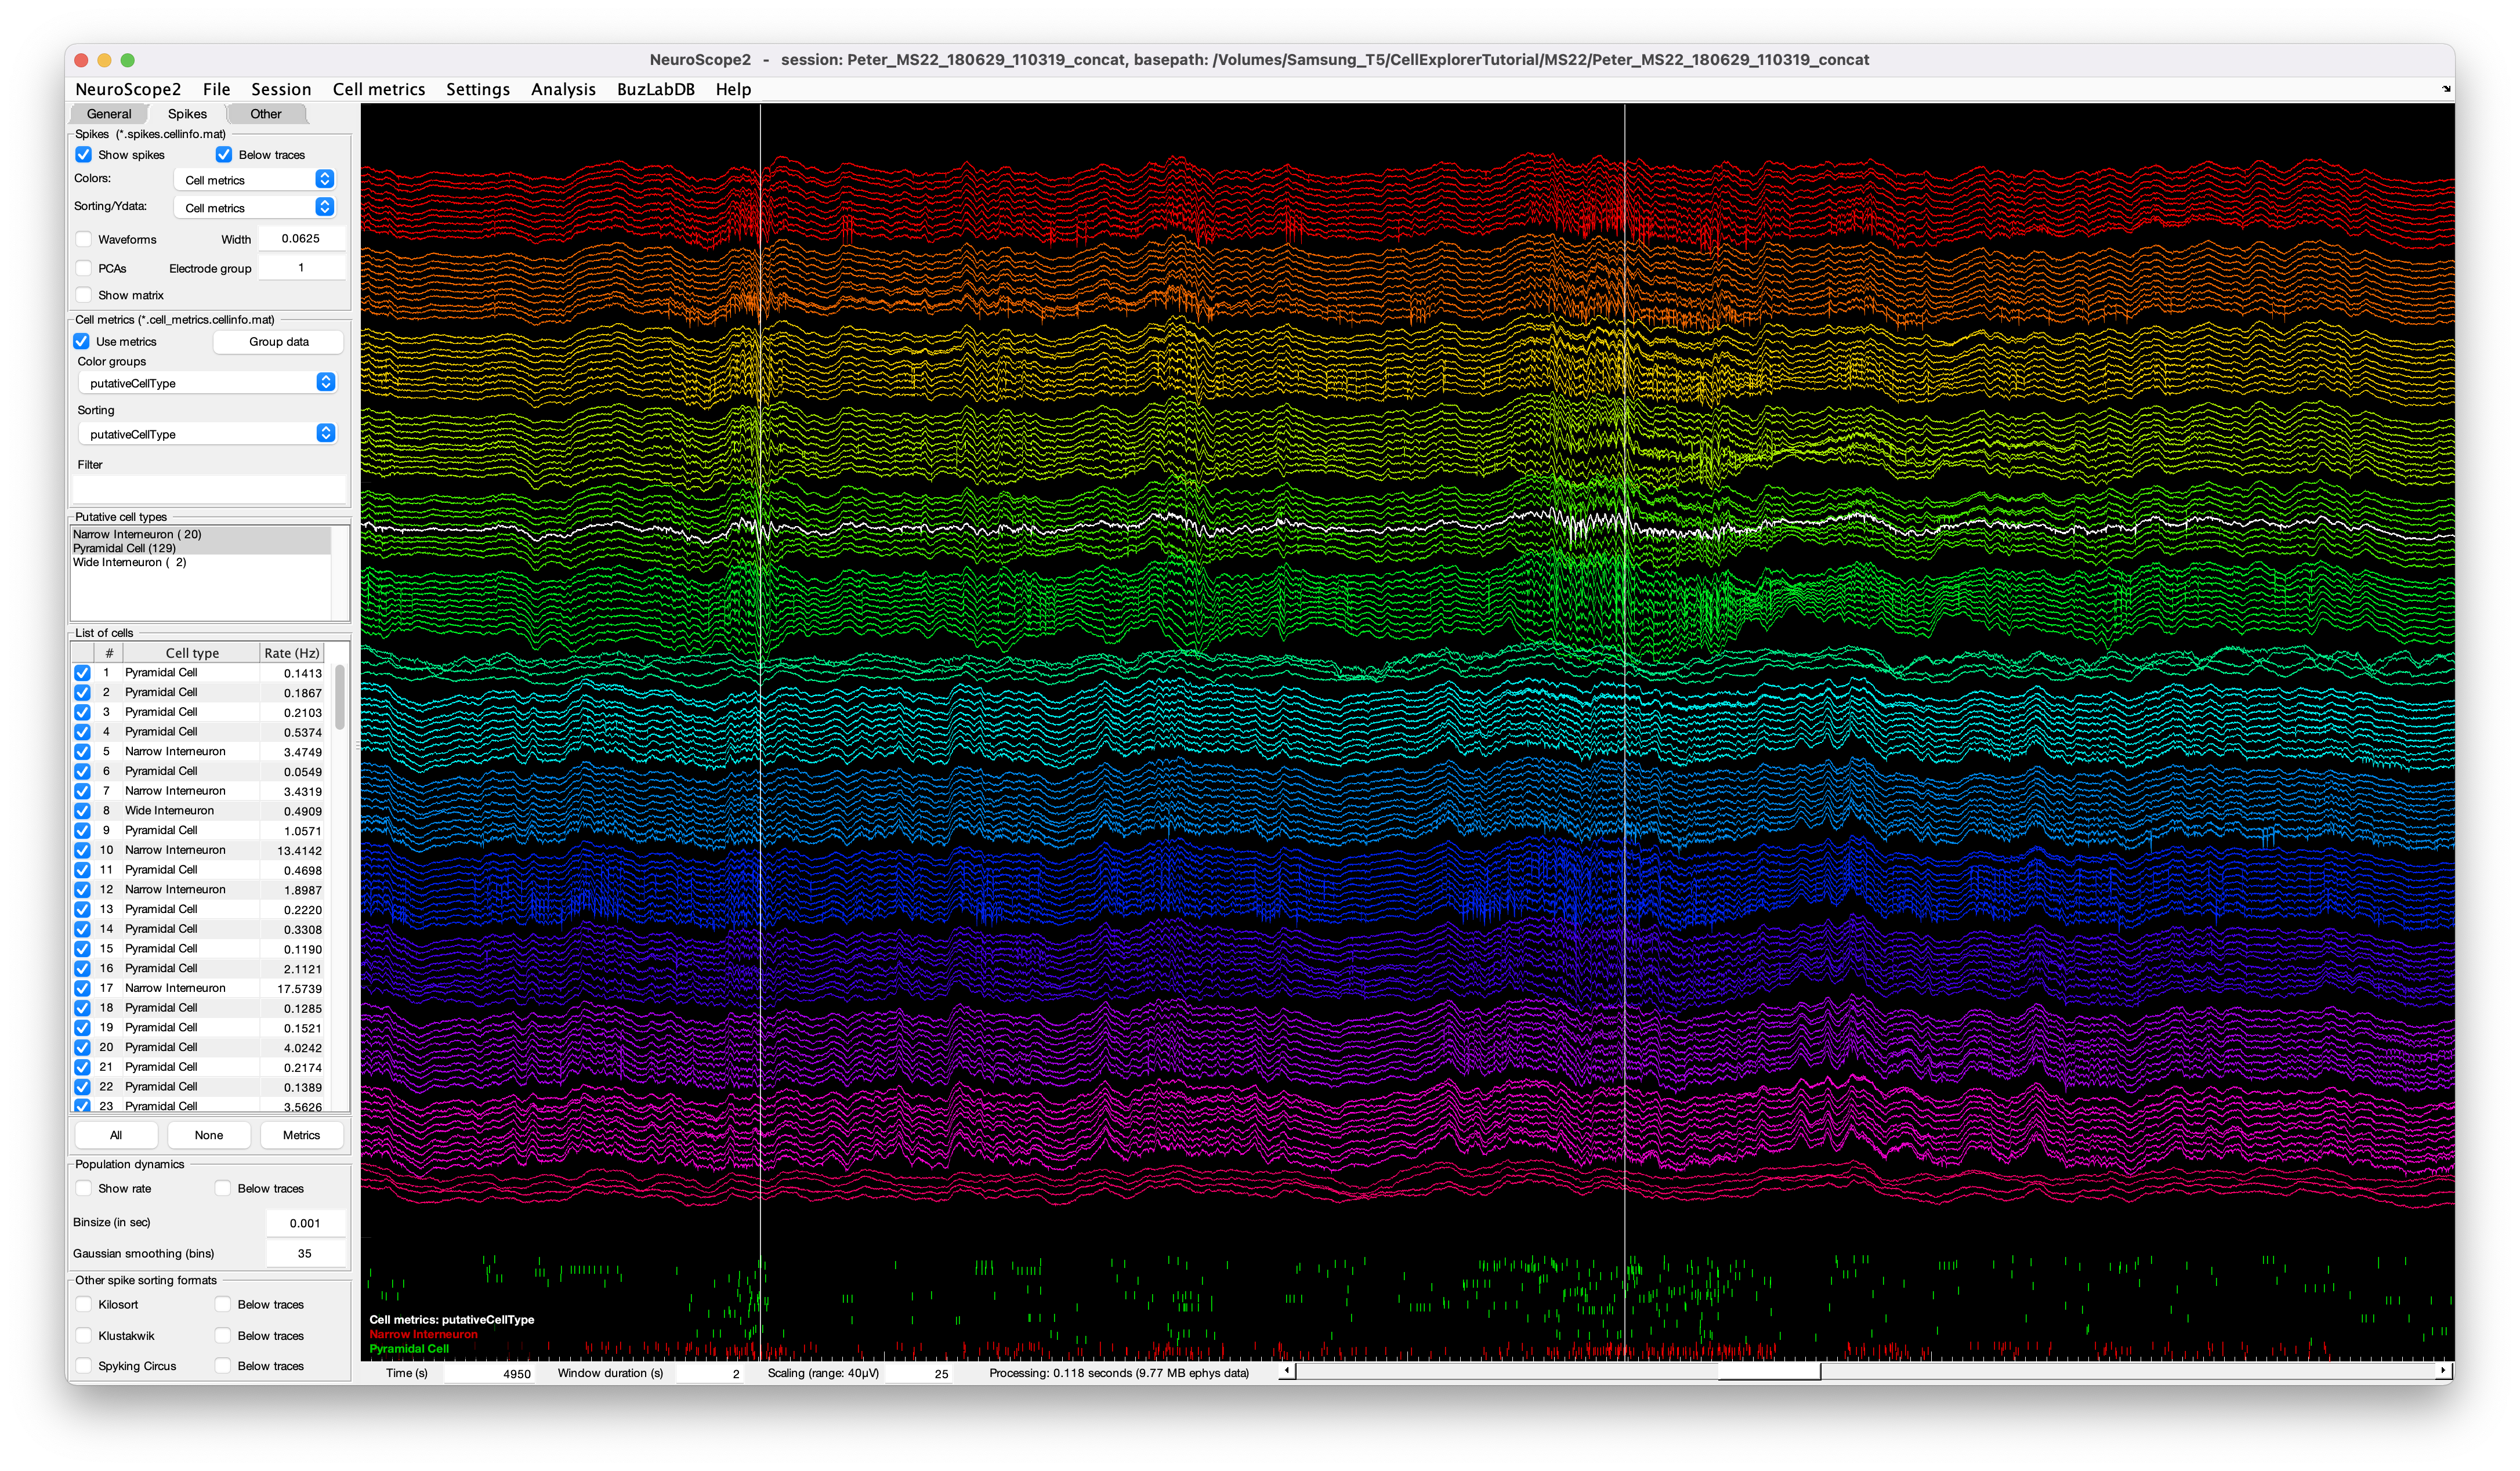
The screenshot above shows a 128-channel recording with two ripple events highlighted, the spike raster below is color coded and sorted by putative cell types.
Interface elements
The interface consists of a side panel and a main plot axis. Below the main axis are also navigational elements. The side panel has three tabs focused on: 1. the ephys data, plotting styles and settings, 2. spikes derived data, and 3. other data types and data analysis, including events, time series, states, behavior, spectrogram, RMS noise plot, and a Current Source density visualization.
Benchmarks
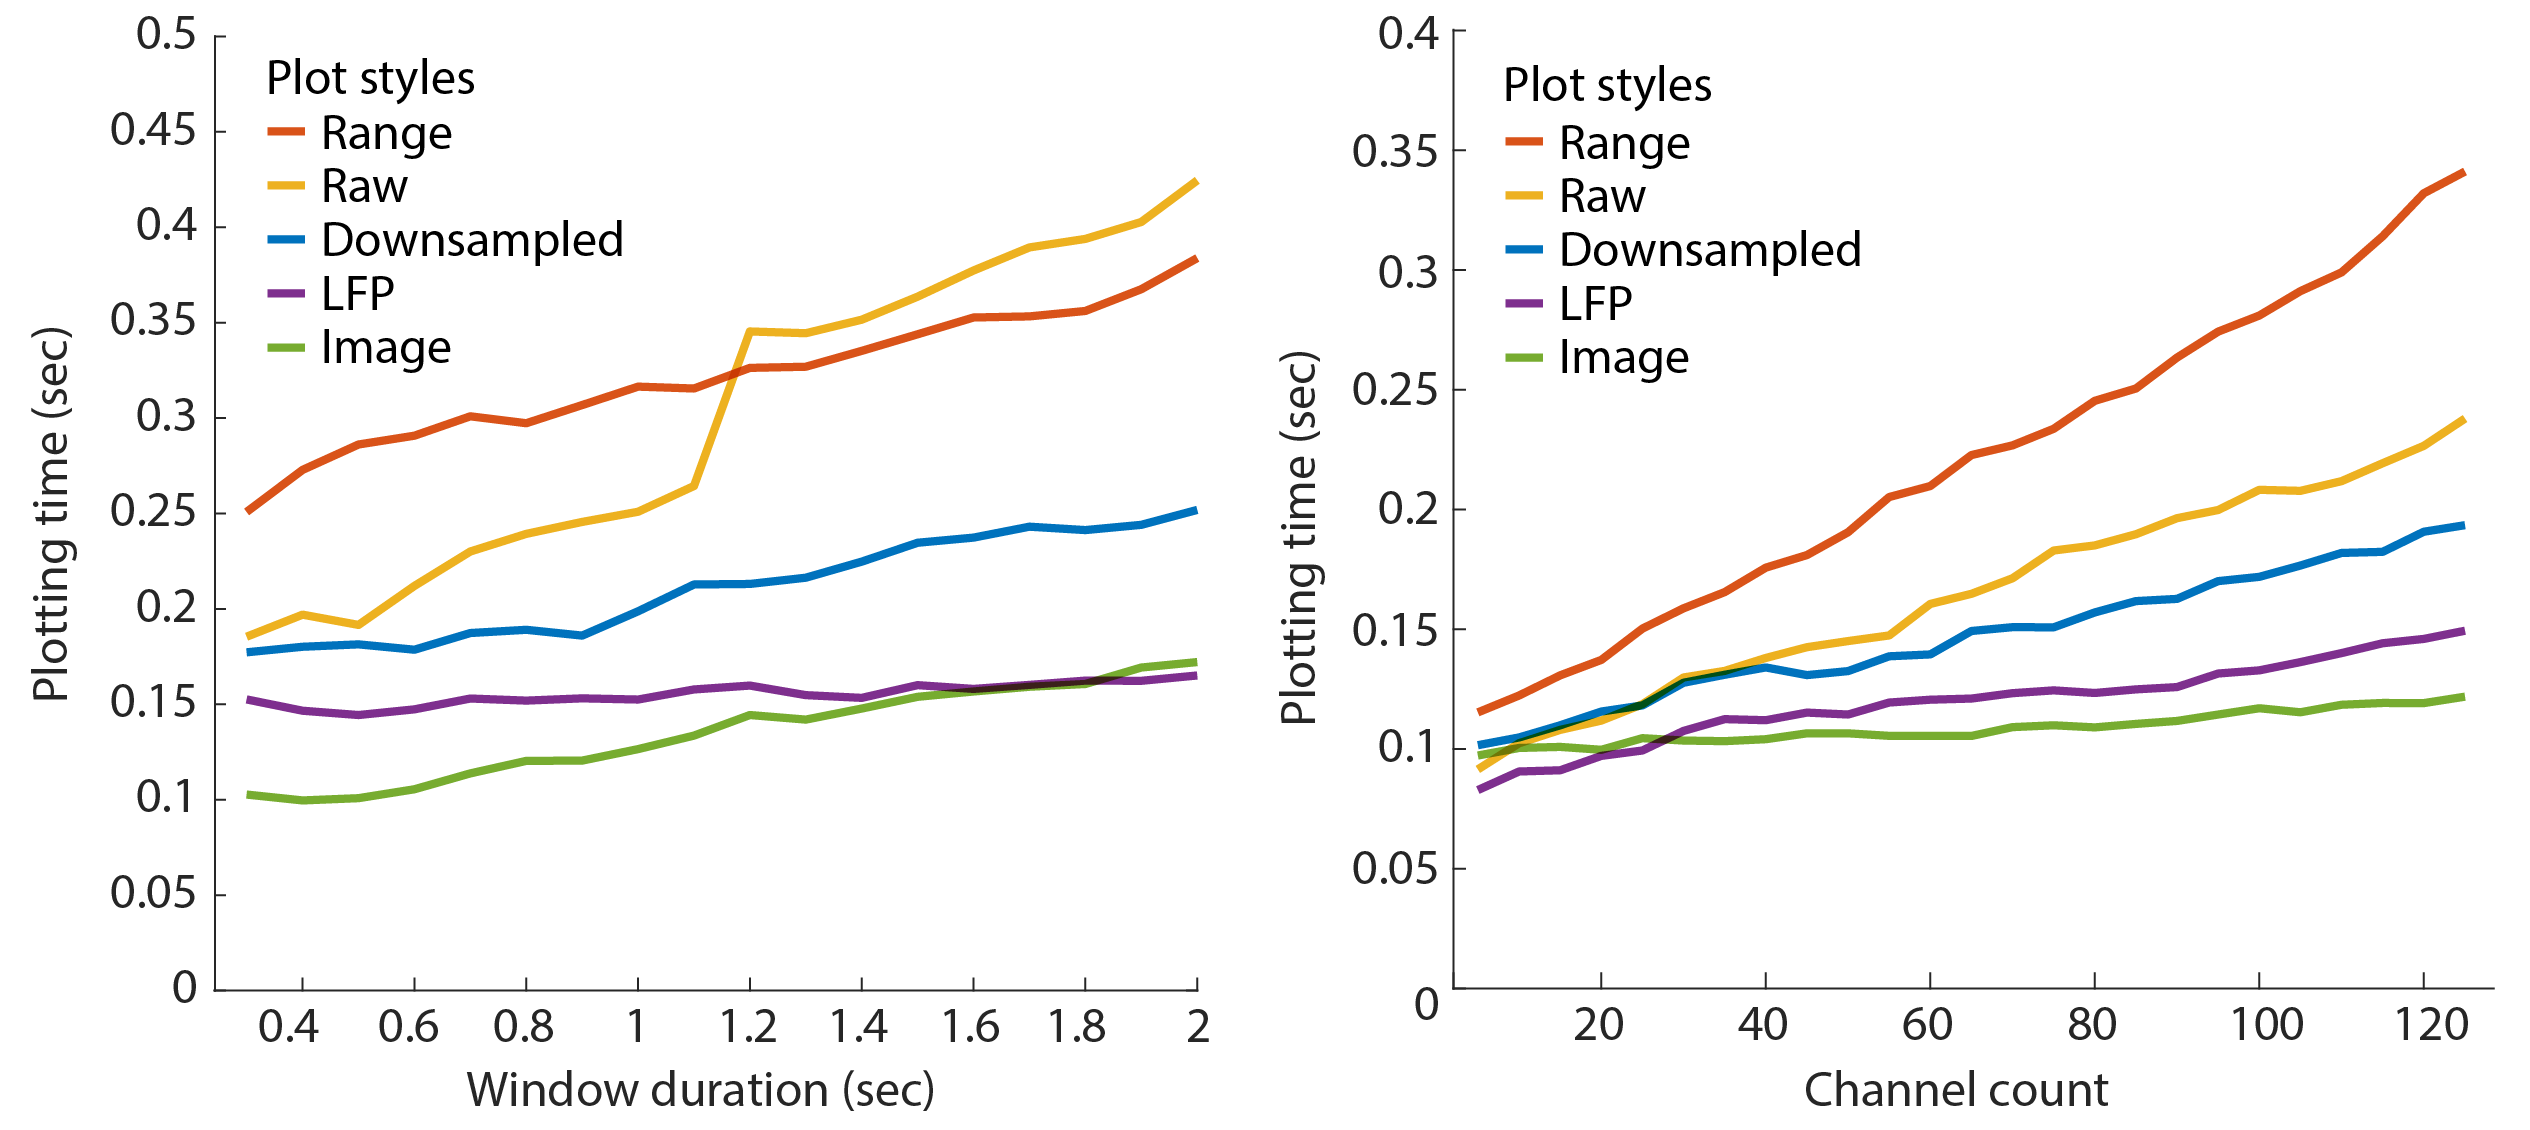
NeuroScope2 is substantially faster than the original NeuroScope. The below figures capture the display time for various window durations (left; i.e. number of samples) and channel count (right) for the 5 plotting styles. The benchmarks were performed on an Apple iMac (5K display) with a 4.2GHz Quad-Core Intel Core i7 with 64GB of ram, a Radeon Pro 580 8 GB graphics card, and data stored on an external SSD. The test was performed on a 128-channel recording, sampled at 20KHz.
Raw data performance
Matlab’s plot performance scales non-linearly with the number of raw data points, but linearly with the number of channels plotted. Adjust the window duration to optimize this. For a recording with 128 channels sampled at 20kHz, the window duration should be kept below 1.2 sec for optimized performance. The window duration should be kept below 0.55 sec for a Neuropixels recording with 384 channels sampled at 30kHz.
Metadata
NeuroScope2 uses the session struct for session-level metadata. Please see this tutorial on how to generate and fill out the metadata. Metadata can be imported from multiple sources: an existing basename.xml file (NeuroSuite), from Intan’s info.rhd file, from KiloSort’s rez.mat file and from a basename.sessionInfo.mat (Buzcode) file.
Open a session with NeuroScope2
In Matlab go to the basepath of the session you want to visualize. Now run NeuroScope2:
NeuroScope2
NeuroScope2 will detect and load an existing basename.session.mat from the folder. If it is missing, it will generate the metadata Matlab struct using the template script sessionTemplate. The template script will detect and import metadata from:
- An existing
basename.xmlfile (NeuroSuite) - From Intan’s
info.rhdfile - From KiloSort’s
rez.matfile - From a
basename.sessionInfo.mat(Buzcode) file.
You can also specify a basepath or a session struct when opening NeuroScope2:
% Open NeuroScope2 specifying a basepath
NeuroScope2('basepath',basepath)

% Open NeuroScope2 specifying a session struct
NeuroScope2('session',session)
Open a session from the File menu in NeuroScope2
A new dataset can be loaded from the File menu in NeuroScope2. Select Load session from file, to open a file dialog and select any file from the basepath of the session you want to open, that contains the basename, e.g. basename.session.mat.
Display digital and analog files in NeuroScope2
Other time series data can also be shown in NeuroScope2, including both analog and digital signals. You can use the session GUI gui_session.m for manual entry of the required time series metadata (e.g. filename, number of channels, sampling rate) as described here.
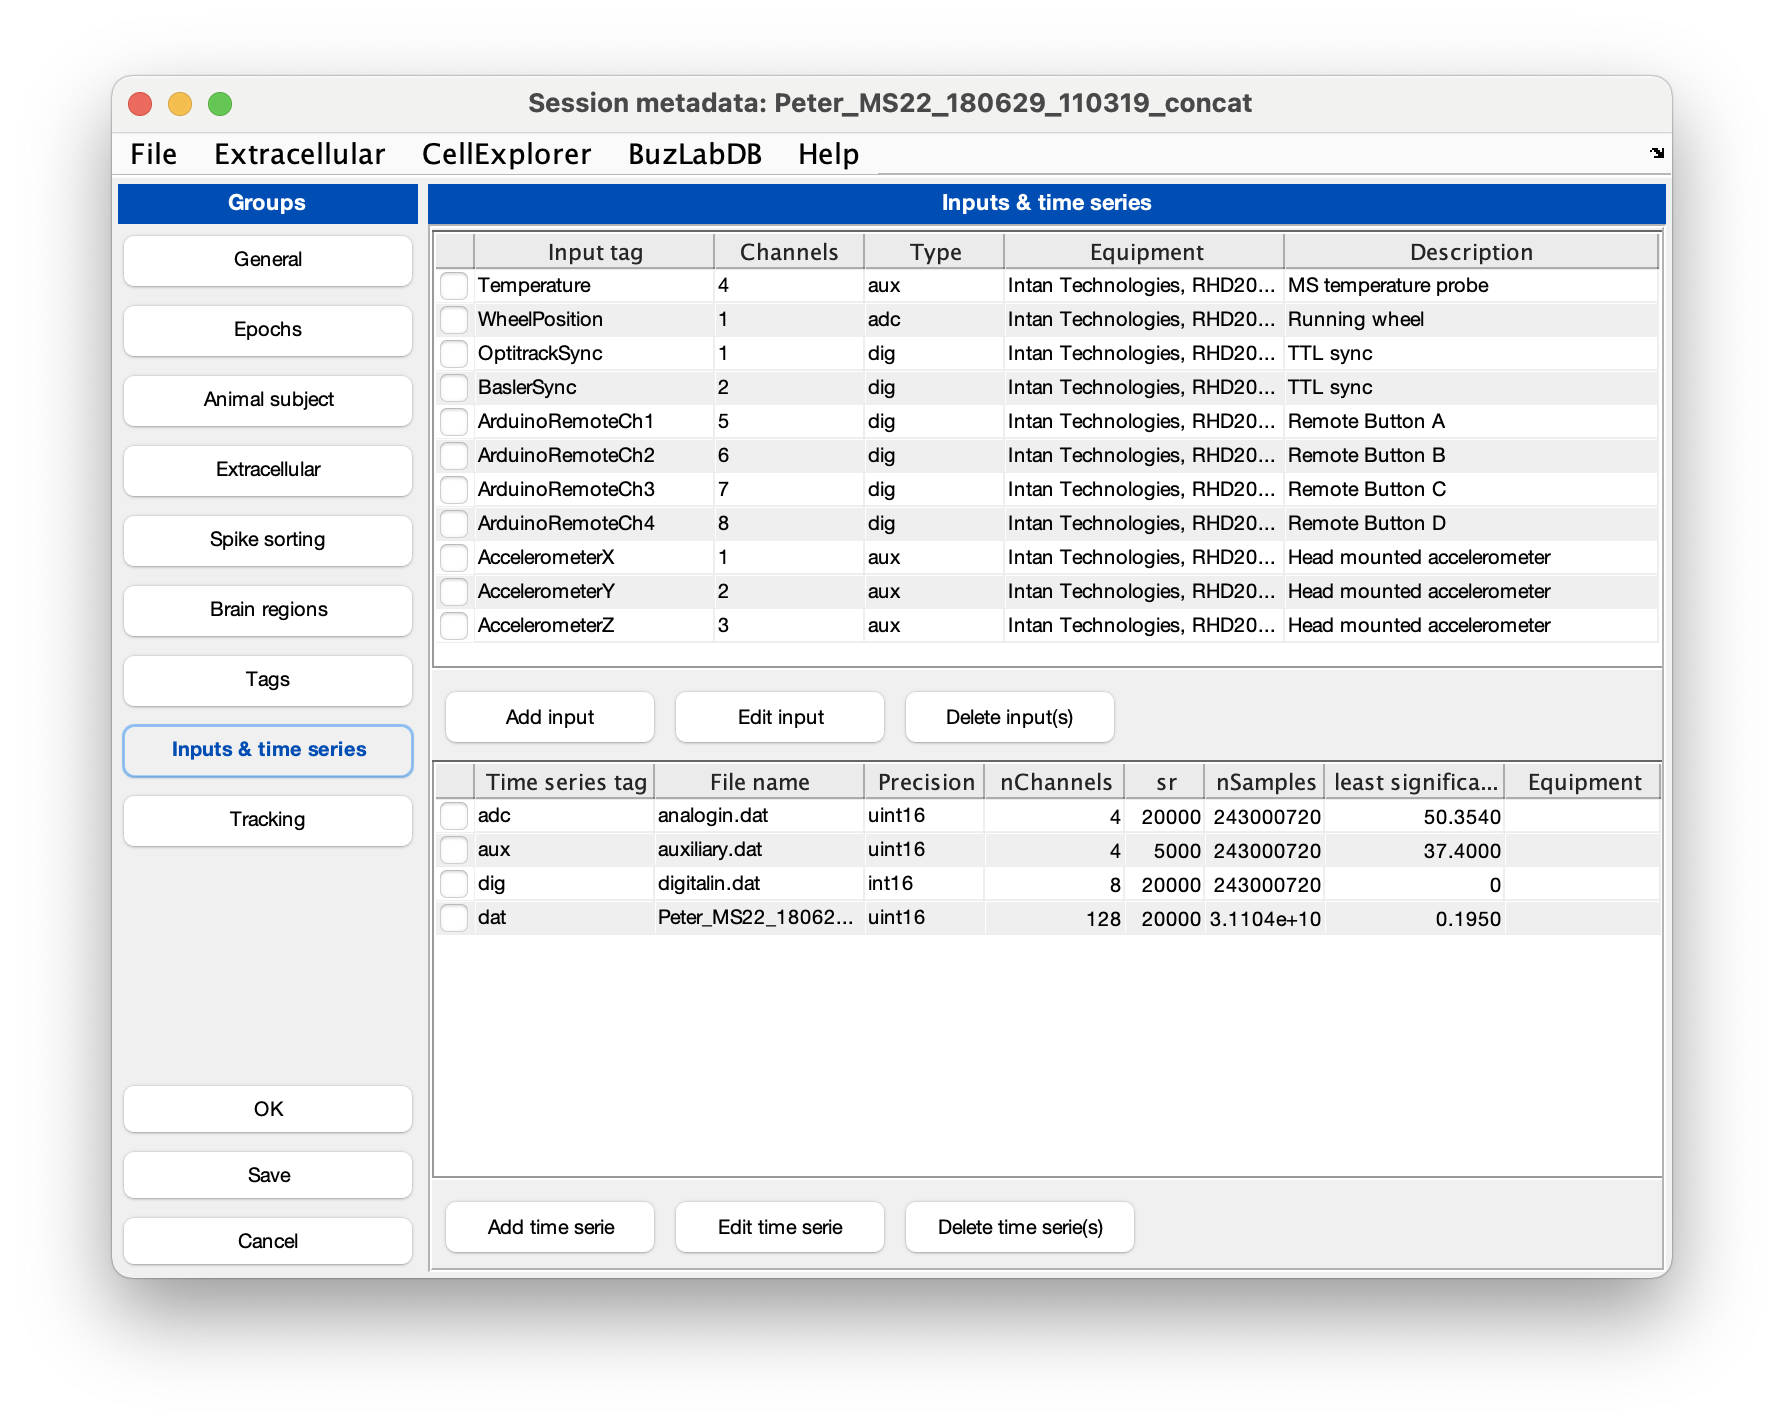
Intan’s analog and digital files are treated as time series and the metadata is stored in the session struct. The metadata can be imported from Intan’s info.rhd. In the session GUI gui_session.m go to the File menu and select Import time series from Intan info.rhd, this will import the metadata as shown in the screenshot below. Save the changes and close the gui.
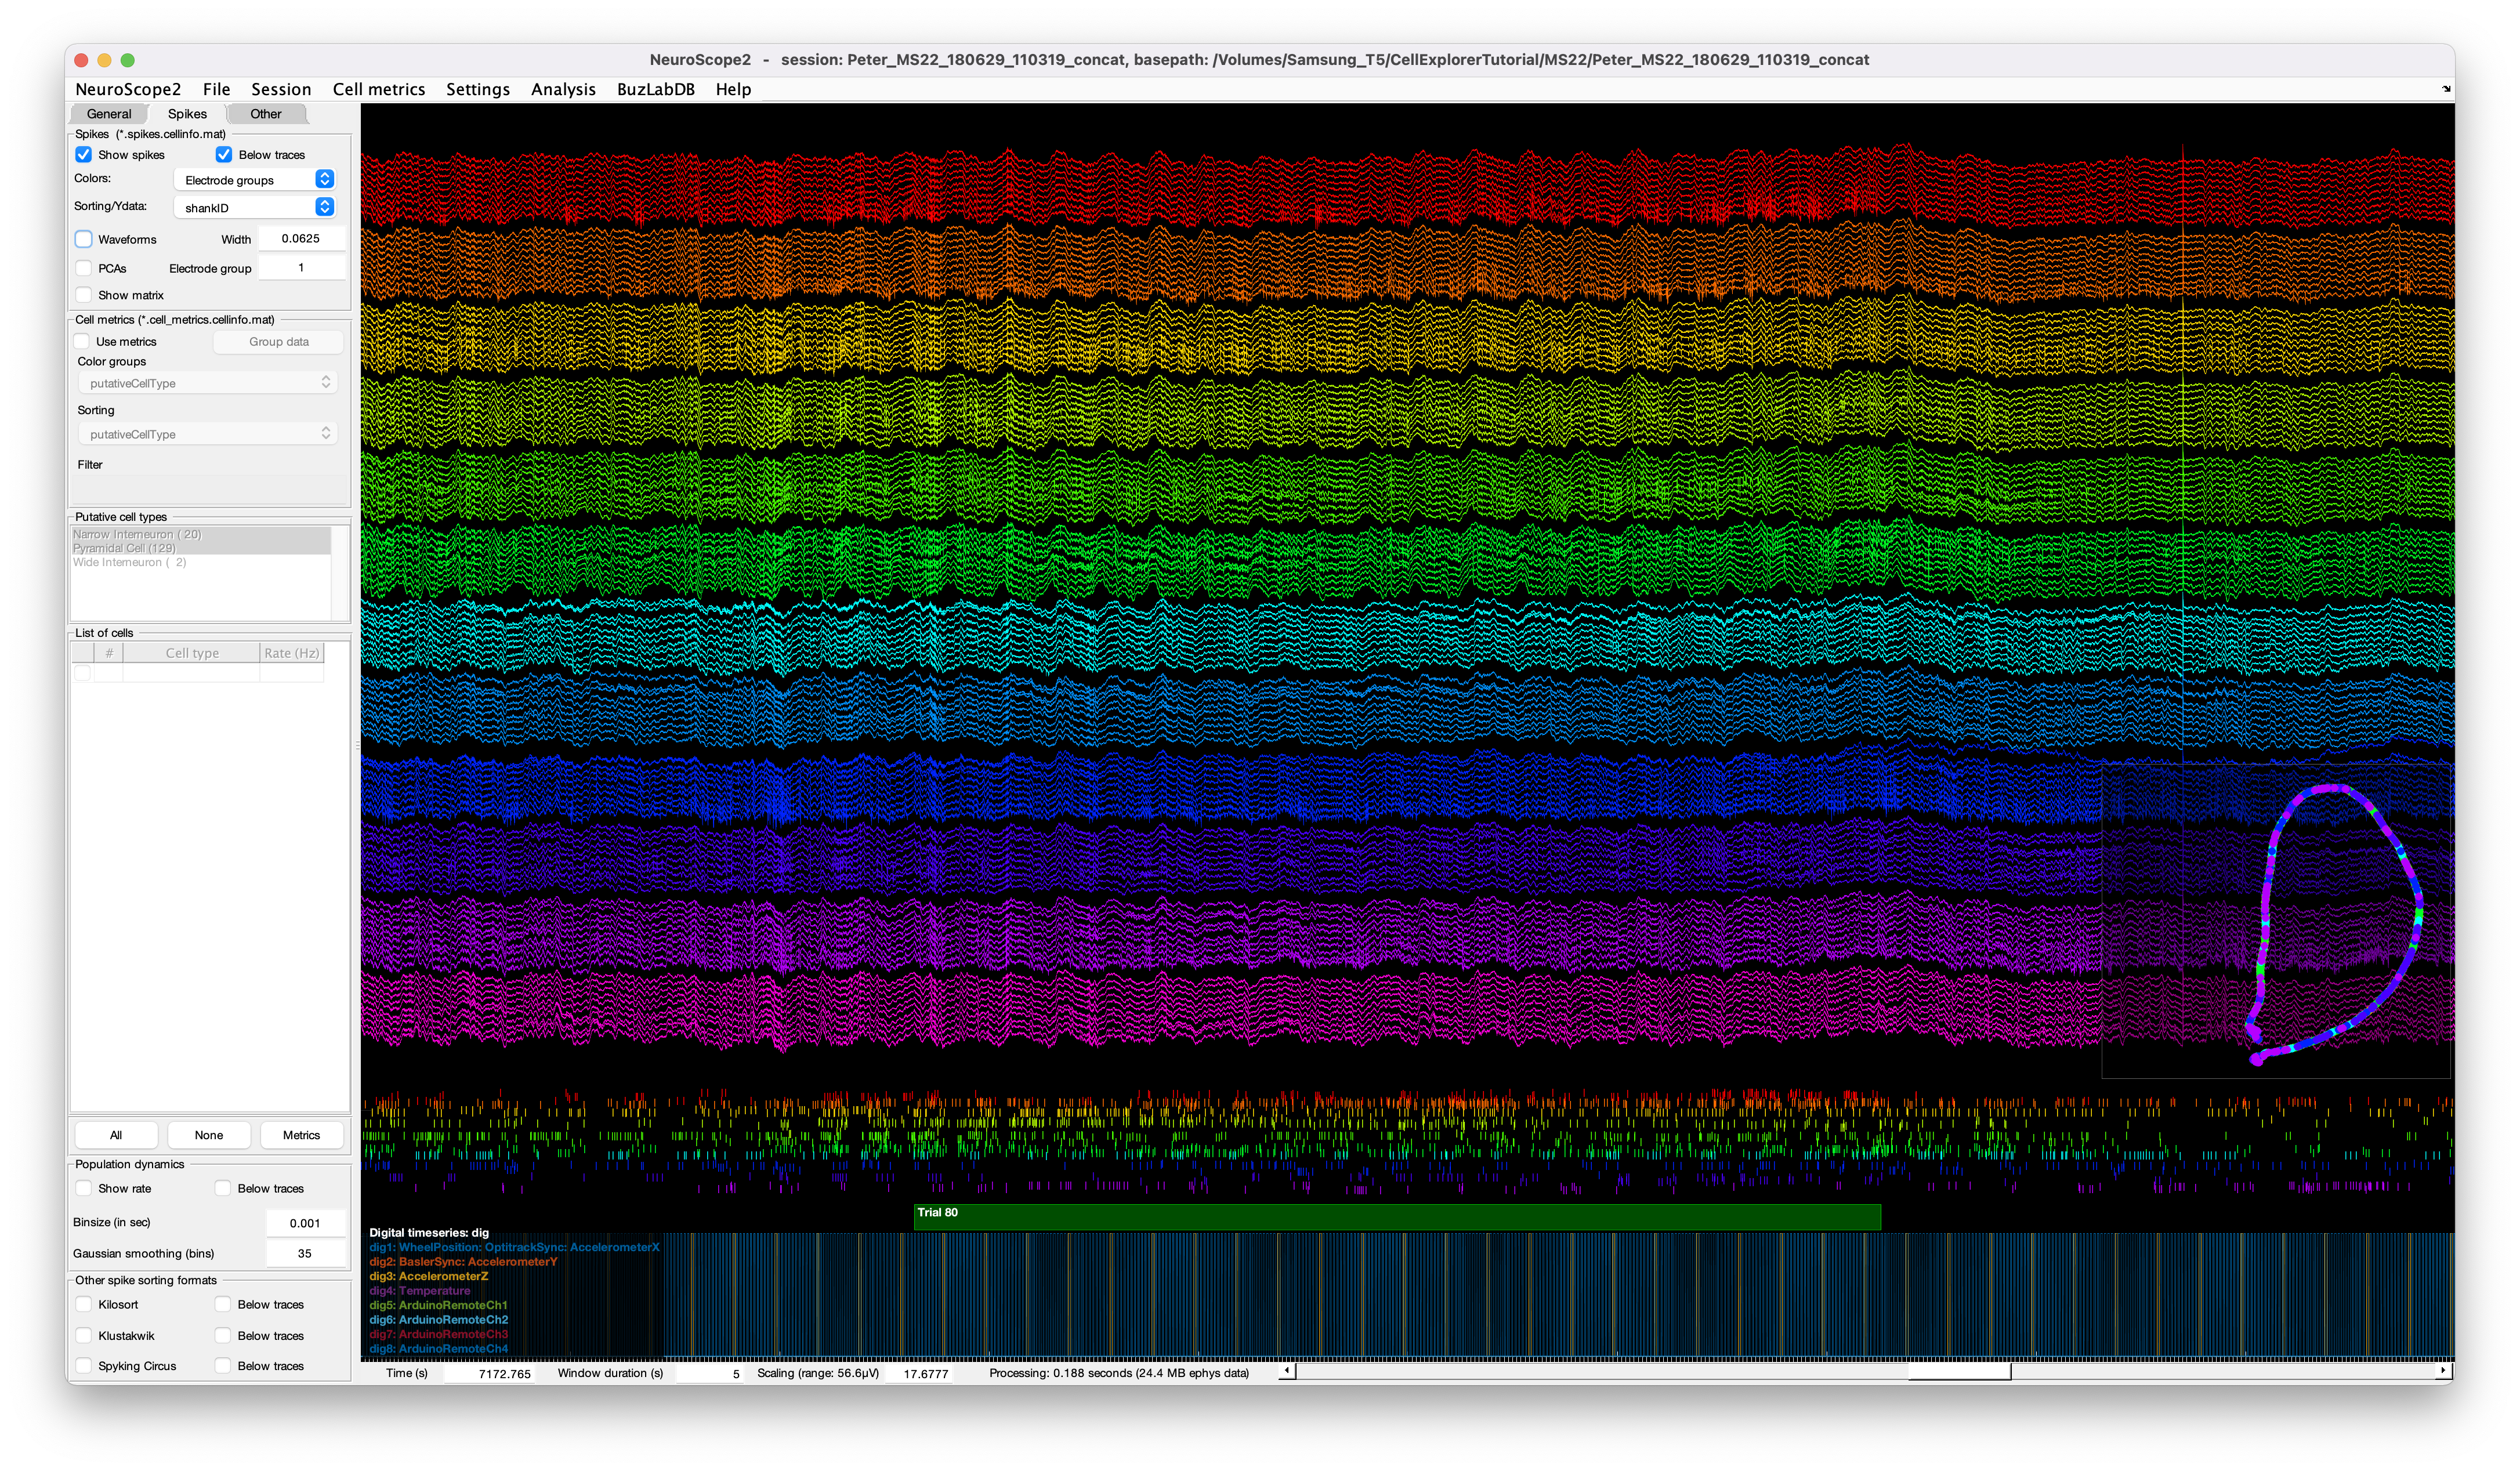
The screenshot above shows a 128-channel recording with digital pulses shown below and a behavior-plot-inset in the lower right corner. The spike raster below the traces is color coded and sorted by electrode groups.
About the software implementation
NeuroScope2 can be modified and hacked and additional functionality can be implemented by using the data structured and main calls described in the below sections.
The data structure in NeuroScope2
NeuroScope2 used global Matlab structures to handle settings and the various data types:
data: Struct with all data loaded from various Matlab files:data.spikes,data.events,data.states,data.behavior.ephys: Struct with the ephys data for current shown time interval (streamed data), e.g.ephys.raw(raw unprocessed data),ephys.traces(processed data).UI: Struct with UI elements and settings, e.g.:UI.fig(figure handle),UI.plot_axis1(main plot axis),UI.settings(settings),UI.menu(menu elements),UI.panel(the various panels),UI.elements(UI elements like buttons and text fields).
The primary function calls in NeuroScope2
Below embedded functions are called to initialize various elements and during data visualization:
initUI: Initializes UI elements including the menu, panels, and plot axes.initData: Initializes data handles and visualization elements derived from the data.initInputsInitializes any user-specific input (optional)initTraces: Initializes trace, including offsets, sorting, and applying filters. Called when changing the window size, amplification hiding/showing channels or groups.plotData: Main call visualizing all data types.plotDatacontains sub-calls for plotting ephys data (plot_ephys), spikes (plotSpikeDataandplotKilosortData,plotKlustaData,plotSpykingcircusData), states (plotTemporalStates), events (plotEventData), time series (Matlab time series files;plotTimeSeriesData) , behavior (plotBehavior), trial data (plotTrials) and other time series data (e.g. digital TTL pulses or extra analog signals;plotAnalogandplotDigital).
Use these calls if you want to customize or add additional functionality.
Support
Please use the GitHub issues system for reporting bugs, enhancement requests or general questions.