Cell-type classification
In the processing pipeline, cells are classified into three putative cell types: Narrow Interneurons, Wide Interneurons and Pyramidal Cells.
- Interneurons are selected by 2 separate criteria:
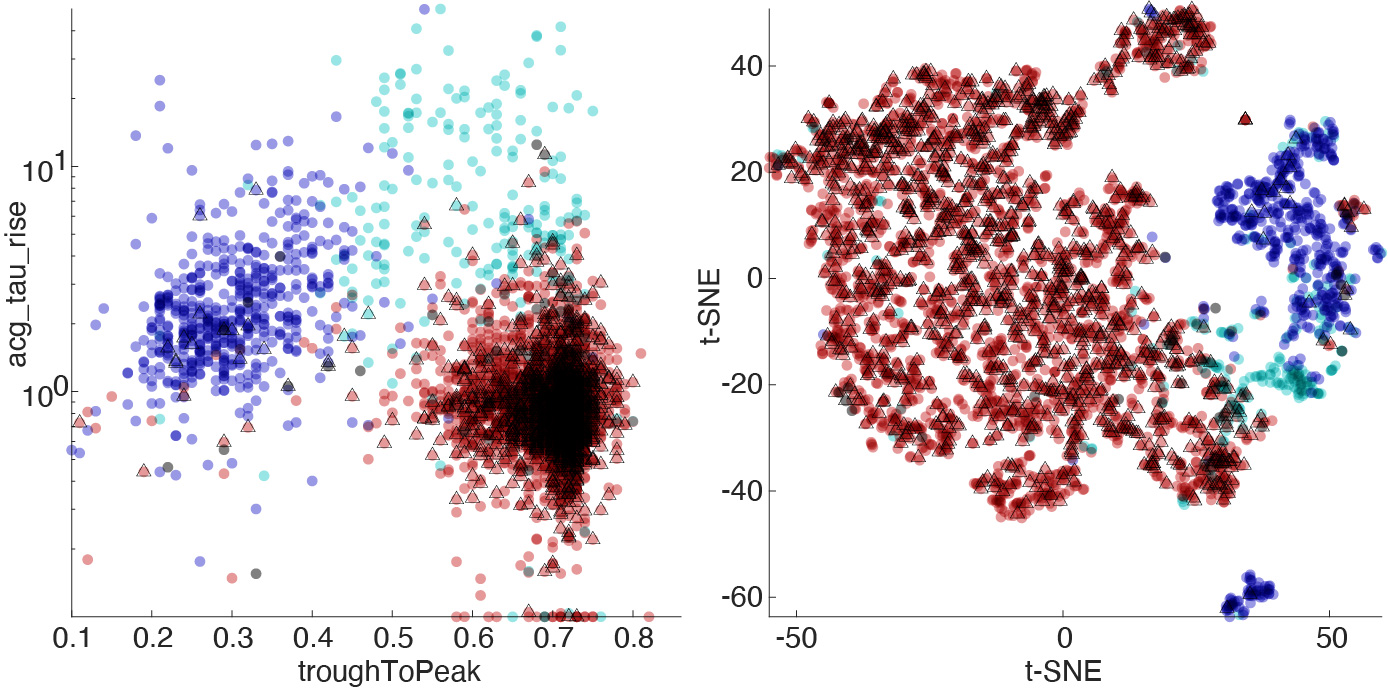
- Narrow interneuron assigned if troughToPeak <= 0.425 ms
- Wide interneuron assigned if troughToPeak > 0.425 ms and acg_tau_rise > 6 ms
- The remaining cells are assigned as Pyramidal cells.
This was inspired by previous papers from our lab (Sirota et al., Neuron 2008; Stark et al., Neuron 2013; Senzai and Buzsaki, Neuron 2017; English et al., Neuron 2017; Senzai et al., Neuron 2019), where the autocorrelogram fits supplement the classical separation approach based on spike waveform features.
Pyramidal cells have a wide waveform, are typically bursty with an average firing rate below 2Hz. PV and SST cells have a much more narrow waveform, a higher base firing rate and are much less likely to burst during physiological in vivo conditions.
The wide waveform interneurons are harder to distinguish from pyramidal cells. Here we introduce the autocorrelogram as a dimension for capturing this difference. Autocorrelograms are fitted with a triple-exponential equation:
\[ACG_{fit} = max(c(\exp(\frac{-(x-t_{refrac})}{\tau_{decay}})-d\exp(\frac{-(x-t_{refrac})}{\tau_{rise}}))+h\exp(\frac{-(x-t_{refrac})}{\tau_{burst}})+rate_{asymptote},0)\]To support this separation we have included ground truth opto-tagged interneurons into CellExplorer (PV, SST and VIP) and further determined excitatory vs inhibitory cells by monosynaptic connections. There is no golden rule that works across brain regions and behavioral states, but the parameters can serve as guidance. The narrow waveform cells are almost entirely inhibitory as verified by opto-tagging and monosynaptic connections, while the wide waveform cells are more difficult to separate. A smaller fraction is know to be interneurons, which are typically less bursty than pyramidal cells.
Hippocampal data
Below figure shows the cell-type separation on hippocampal data from Petersen and Buzsaki (Neuron, 2020), and hippocampal data collected by Viktor Varga (not published yet). The triangles indicate excitatory cells determined from monosynaptic connections. Dark blue: Narrow interneurons, Cyan: Wide interneurons, Red: Pyramidal cells. 
Cortical data
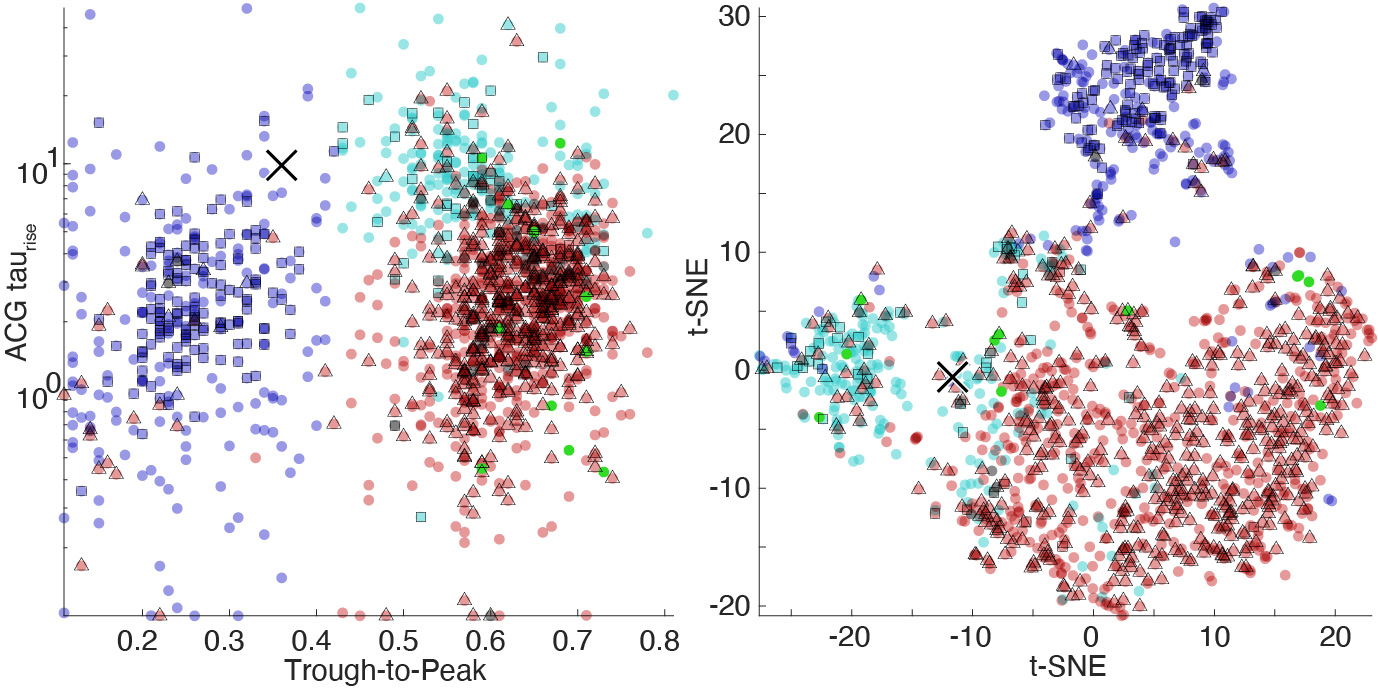
Below figure shows the cell type separation applied to the cortical data from Senzai et al., Neuron 2019. The triangles and squares indicate excitatory and inhibitory cells determined from monosynaptic connections. Dark blue: Narrow interneurons, Cyan: Wide interneurons, Red: Pyramidal cells. 
Ground truth cells
Below figure shows the various ground truth interneurons projected on the cortical data from the previous figure determined by opto-tagging. Learn more about the ground truth cells here. 